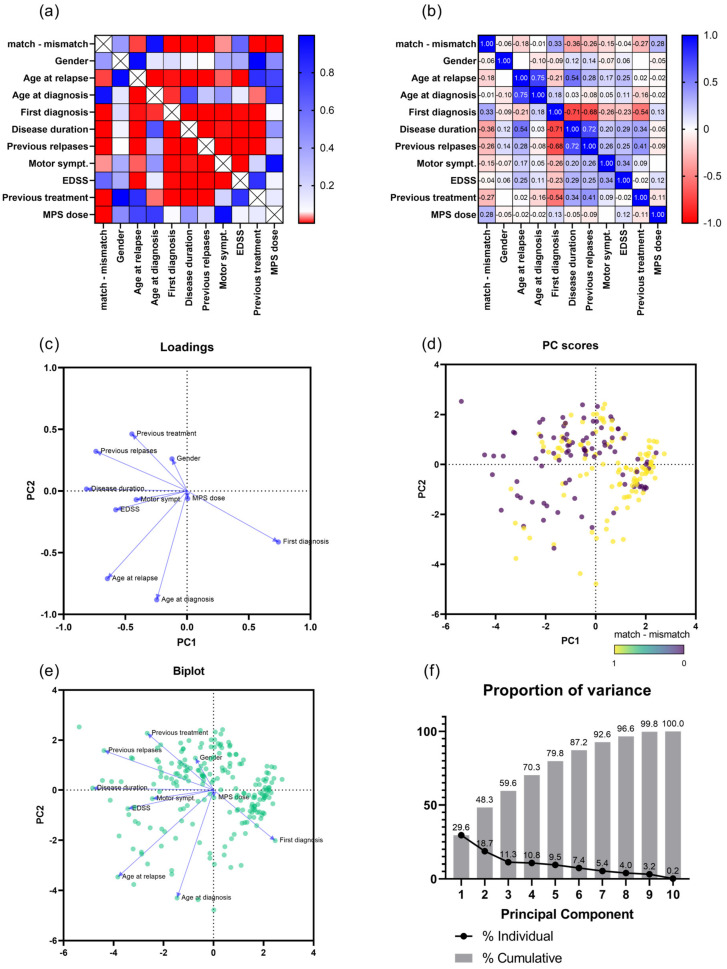
Figure 2.
(a) Correlation matrix, p values are color coded, significant correlations are marked in red. (b) Correlation matrix, r values are displayed within squares and color coded according to positive correlations (blue) and negative correlations (red). (c) Principal component analysis, graphical representation of contributing factors to principal component 1 (PC1) and 2 (PC2). (d) Distribution of patients with clinical-radiological match (yellow dots) and clinical-radiological mismatch (purple dots) according to PC1 and PC2. (e) Merged representation of patients and the contributing factors for PC1 and PC2. (f) Proportion of variance, explained by principal components, PC1 and PC2 explain 48.3% of variance. Abbreviations: symp. = symptoms, MPS = methyl prednisolone, EDSS = Expanded Disability Status Scale, PC = principal component.

