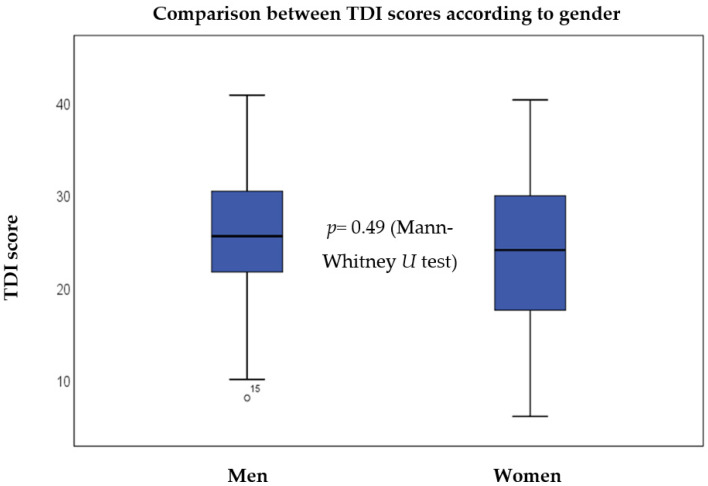
Figure 1.
Comparison between the TDI values according to gender. The boxes represent the middle 50% of the data, and the whiskers represent the upper and lower 25%. The black line inside the boxes represents the median value. Differences were analysed using the Mann–Whitney U test (p < 0.05 *). TDI = Threshold, Discrimination, Identification.

