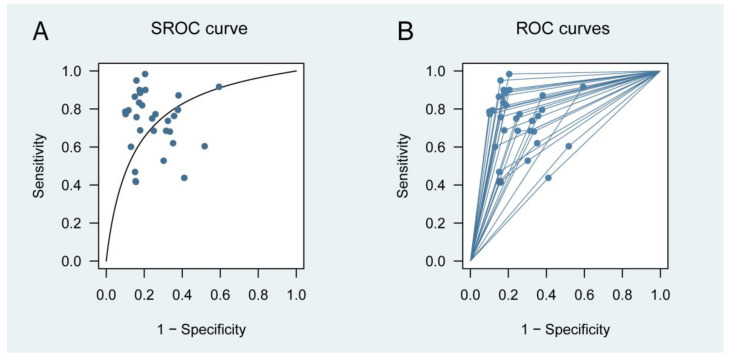
Figure 3.
Test performance for predicting relapse in patients with IBD. (A) Multiple threshold SROC curve; (B) multiple threshold ROC curves based on the multiple thresholds model. Circles represent information on sensitivity and specificity. ROC, receiver operating characteristic; and SROC, summary receiver operating characteristic.

