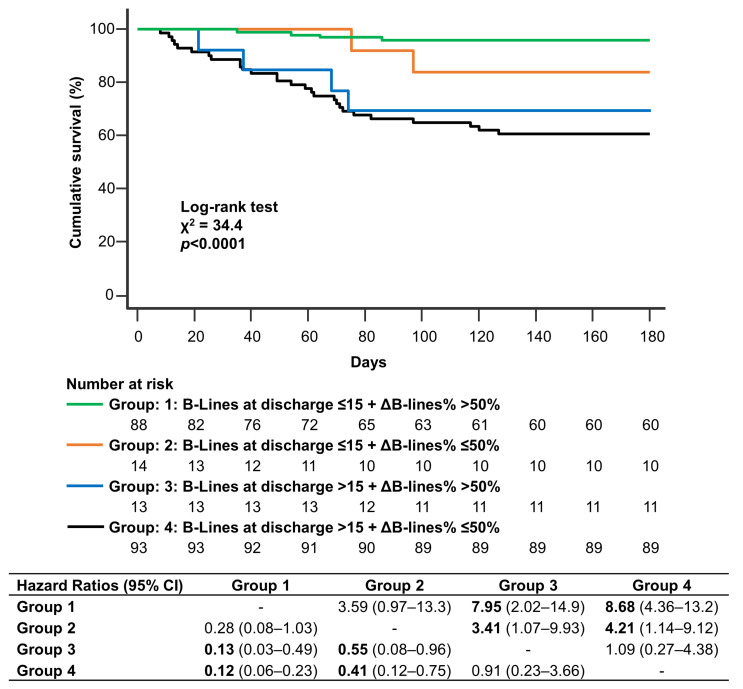
Figure 3.
Kaplan-Meier survival analysis for the primary endpoint (cardiovascular death and rehospitalization for heart failure) according to B-lines at discharge and ΔB-lines%. Patients are stratified in four groups according to B-lines at discharge (> 15 or ≤15) and ΔB-lines% (≤50% or >50%). Numbers of patients at risk are shown below the survival curves. Pairwise comparison between groups is shown in accompanying table using hazard ratios and 95% confidence intervals.

