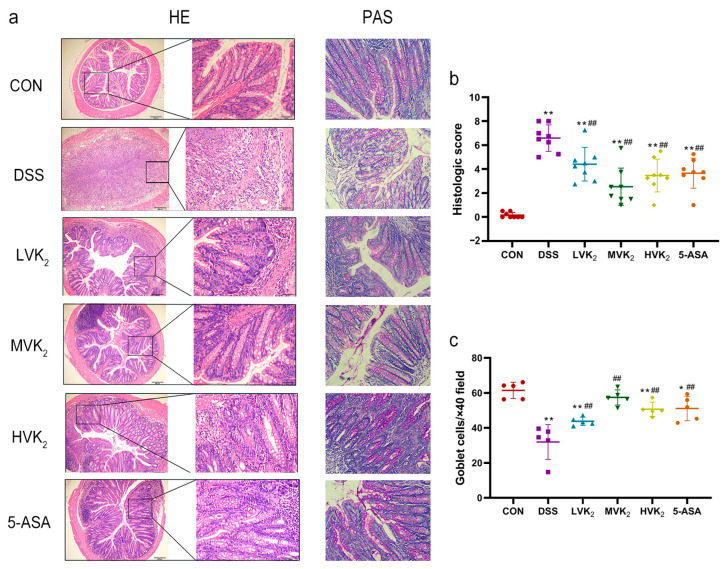
Figure 2.
Histological observations of colons. (a) Colon H&E and PAS staining in each group. (b) Histopathological scores. (c) Goblet cell numbers. We report the results as means ± SDs, and n = 5–8. We determined the statistical significance using a one-way ANOVA with LSD comparison adjustment. * p < 0.05 and ** p < 0.01 in comparison to the CON group; ## p < 0.01 in comparison to the DSS group.

