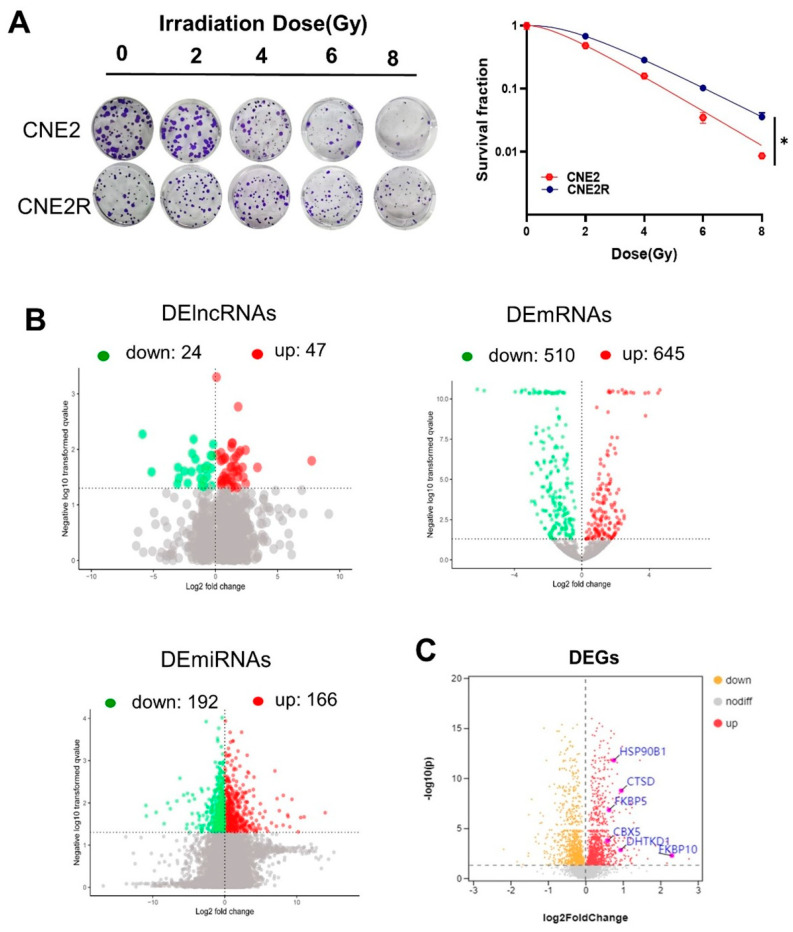
Figure 1.
RNA profile analyses of CNE2 and its paired radioresistance CNE2R cells: (A) colony formation assay was performed to evaluate the radiosensitivity of CNE2 and CNE2R cells. * p < 0.05 between indicated groups; (B) volcano plots of the DElncRNAs, DEmRNAs, and DEmiRNAs between CNE2 and CNE2R cells based on RNA−seq assay; (C) volcano plot of differentially expressed genes (DEGs) between CNE2 and CNE2R cells based on TMT assay.

