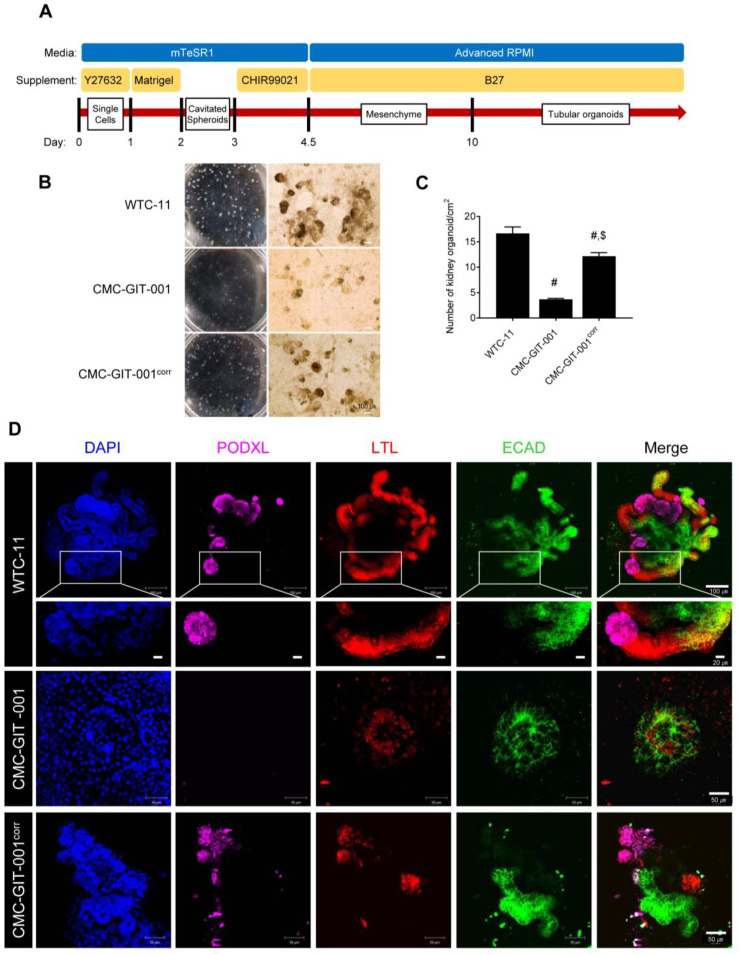
Figure 3.
Differentiation of kidney organoids from CMC-GIT-001 and CMC-GIT-001corr hiPSCs. (A) Schematic timeline of the hiPSC differentiation protocol. (B) Whole-well bright field observations and light micrograph of the kidney organoids. Scale bar = 100. (C) Comparison of the number of matured kidney organoids in CMC-GIT-001 and CMC-GIT-001corr. Data are presented as mean ± SE. # p < 0.05 vs. WTC-11; $ p < 0.05 vs. CMC-GIT-001. (D) Representative immunofluorescence image of PODXL, LTL, and ECAD kidney organoids from WTC-11 as a control, CMC-GIT-001, and CMC-GIT-001corr. Scale bar = 50 or 100 μm.

