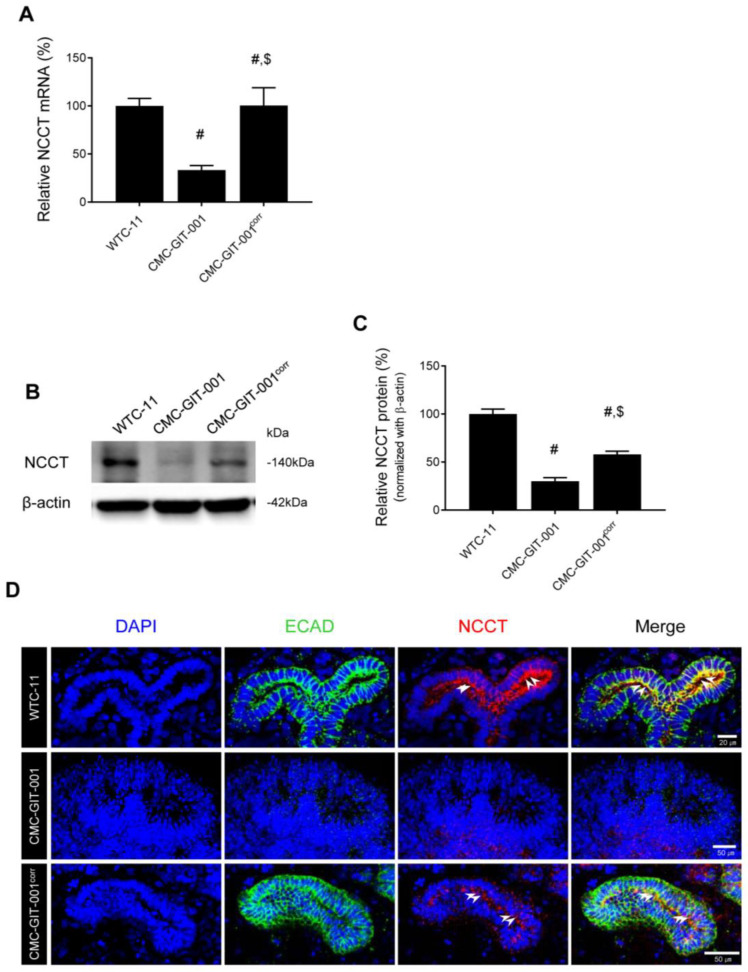
Figure 4.
Expression of NCCT in kidney organoids from CMC-GIT-001 and CMC-GIT-001corr iPSCs. The NCCT mRNA (A) and protein expression (B,C) in the kidney organoids from WTC-11 as a control, CMC-GIT-001, and CMC-GIT-001corr. Relative NCCT mRNA and protein expression was presented after normalization to GAPDH and β-actin expression, respectively. (D) Representative immunofluorescence image of ECAD and NCCT kidney organoids from WTC-11 as a control, CMC-GIT-001, and CMC-GIT-001corr. Data are presented as mean ± SE. # p < 0.05 vs. WTC-11; $ p < 0.05 vs. CMC-GIT-001. # p < 0.05 vs. WTC-11; $ p < 0.05 vs. CMC-GIT-001. Scale bar = 20 or 50 μm.

