Figure 5.
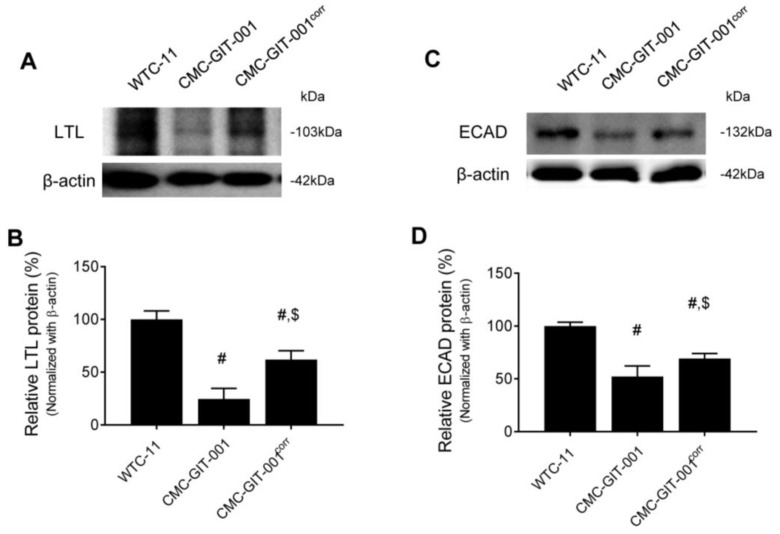
Expression of LTL and ECAD in kidney organoids from CMC-GIT-001 and CMC-GIT-001corr iPSCs. Representative immunoblot image and LTL (A,B) and ECAD (C,D) quantification in the kidney organoids from WTC-11 as a control, CMC-GIT-001, and CMC-GIT-001corr. The relative optical densities of the bands in each lane were normalized to those of each band of β-actin. Data are presented as mean ± SE. # p < 0.05 vs. WTC-11; $ p < 0.05 vs. CMC-GIT-001.

