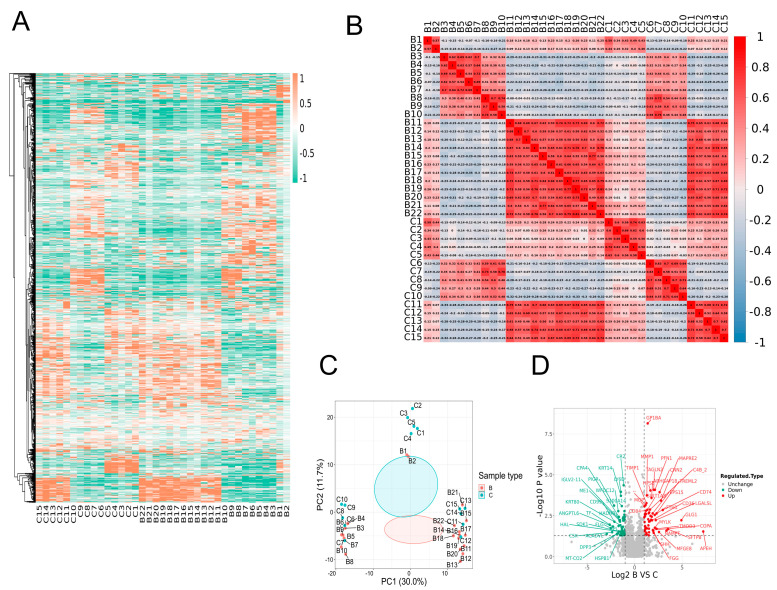
Figure 2.
Proteomic profiling of ET patients and healthy controls. (A) Heatmap analysis of expression profile of proteins. (B) The correlation coefficient matrix of protein. (C) Principal component analysis in both groups. (D) Proteins are presented by the volcano plot. The vertical dotted lines represent proteins with a more than 1.3−fold increase (marked with red) or decrease (marked with green), respectively. The gray dots are considered as no significant change, and horizontal dotted lines display cutoff p−values.

