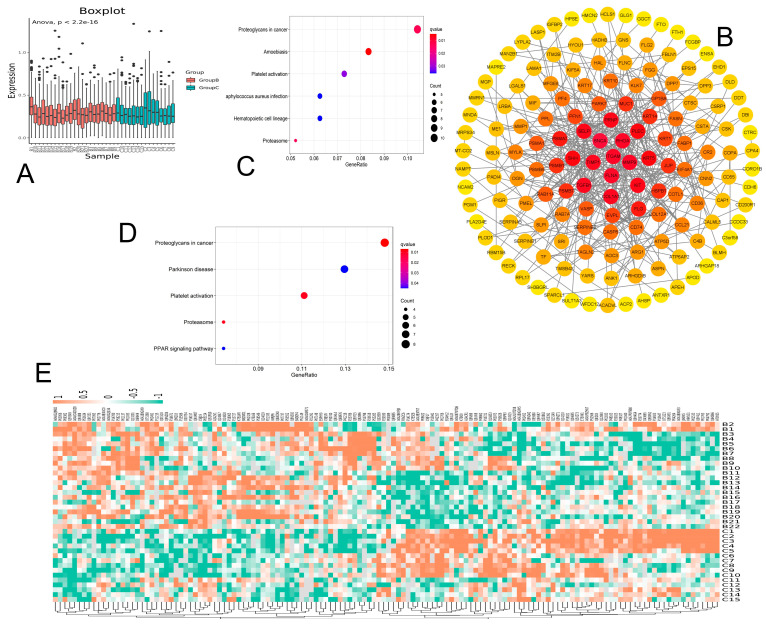
Figure 3.
Bioinformatic analysis of differentially expressed proteins. (A) Boxplot of the differential proteins, with p−values indicating the significance of the difference between the two groups. (B) Differential protein PPI. The closer the protein is to the center, the more important it is in the network. (C) Total differential protein KEGG pathway enrichment. (D) Upregulated differential protein KEGG pathway enrichment. (E) Heatmap analysis of expression profile of differential proteins.

