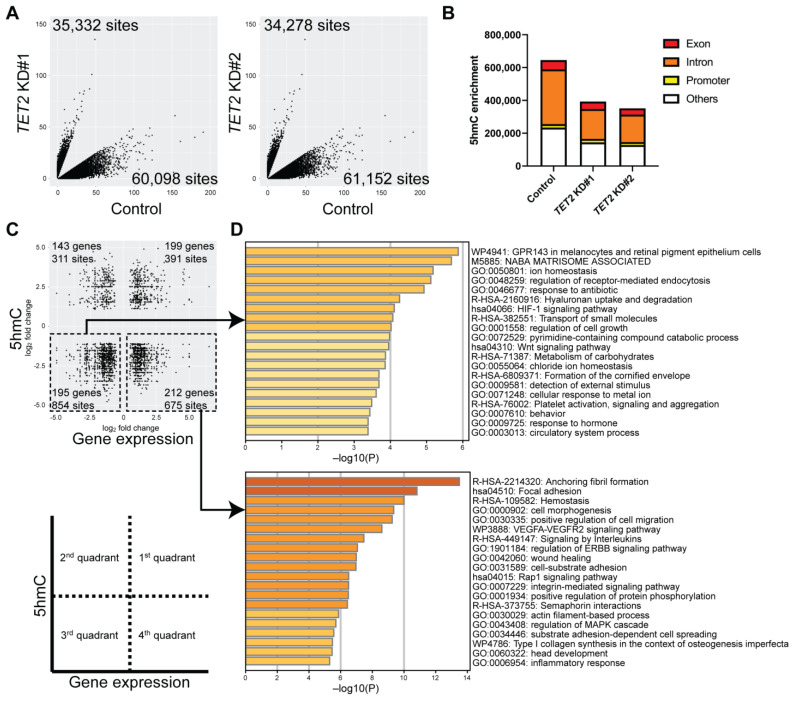
Figure 4.
Identification of epigenetically regulated pathways through integration of RNA-seq and Reduced Representation Hydroxymethylation Profiling (RRHP) analyses of TET2 KD cells. (A) Scatter plots of 5hmC enrichment in TET2 KD#1 (left) and TET2 KD#2 (right) cultures. (B) Bar graphs represent the distribution of 5hmC site numbers in exon, intron, and promoter regions. (C) Scatter plots depict the correlation between the DEGs (x-axis) and corresponding differentially enriched 5hmC levels (y-axis) shared between TET2 KD#1 and TET2 KD#2 cultures selected as described in methods. (D) Metascape enrichment analysis of the downregulated (top) and upregulated (bottom) DEGs with reduced 5hmC levels.

