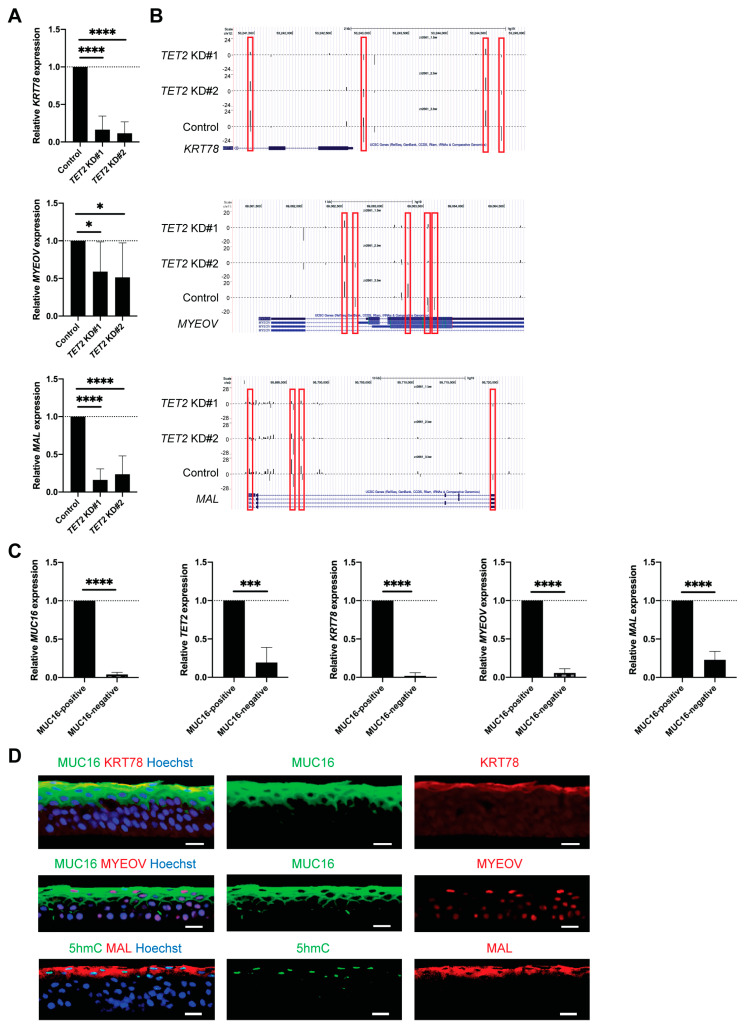
Figure 6.
Identification of KRT78, MYEOV, and MAL as epigenetically regulated corneal differentiation genes. (A) Bar graphs represent relative KRT78, MYEOV and MAL mRNA expression in TET2 KD cells (TET2 KD#1: 16.4 ± 18.2%, TET2 ± KD#2: 11.5 ± 15.3% for KRT78, TET2 KD#1: 59.1 ± 39.5%, TET2 ± KD#2: 51.4 ± 45.9% for MYEOV, TET2 KD#1: 16.2 ± 14.5%, TET2 ± KD#2: 23.7 ± 24.3% for MAL; n = 8, * p < 0.05 and **** p < 0.0001). Data were analyzed using a Tukey’s multiple comparisons test. (B) UCSC genome browser depiction of reduced 5hmC enrichment peaks in the KRT78, MYEOV and MAL genomic regions of TET2 KD cells. (C) Bar graphs represent MUC16, TET2, KRT78, MYEOV, and MAL mRNA expression in sorted MUC16-positive and MUC16-negative cells (relative expression in MUC16-negative cells: 3.9 ± 2.8% for MUC16, 19.3 ± 19.6% for TET2, 1.9 ± 4.2% for KRT78, 5.6 ± 5.5% for MYEOV, 23.0 ± 10.8% for MAL; n = 5, *** p < 0.001, **** p < 0.0001). Data were analyzed using a paired t-test. (D) Representative immunostaining images of MUC16 and KRT78 (top), MUC16 and MYEOV (middle), and 5hmC and MAL (bottom) in the central corneal epithelium. Hoechst 33342 was used for the nuclei staining. n = 3. Scale bar, 20 μm. The red frames depict the 5hmC peaks reduced in TET2 KD cells.

