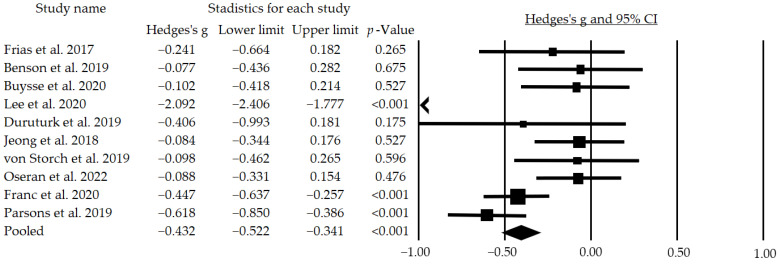
Figure 2.
Effects of telemedicine on HbA1c in people with diabetes. The black box represents the point estimate for the respective study, while the size of the box represents the population size and the horizontal line is the 95% CI. The diamond-shaped figure represents the estimated point of the mean effect size. The arrow represents that the point estimate for this study is less than −1.00 [19,20,21,23,24,25,26,27,30,31].

