Figure 3.
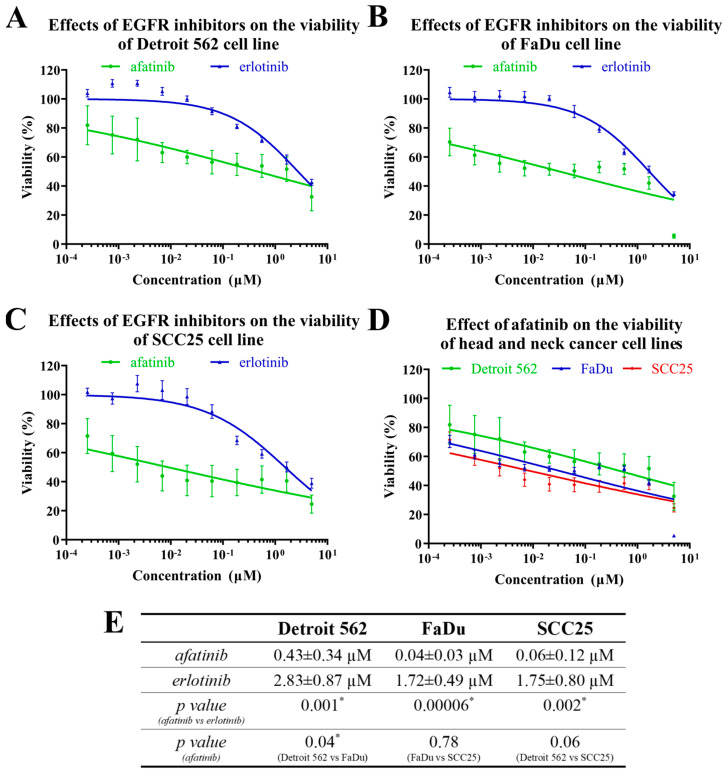
The effects of EGFR inhibitors on head-and-neck-cancer-cell viability. Cell lines were treated with afatinib or erlotinib at different concentrations for 72 h and cell viability was determined by MTT assay. The IC50 curves of the effects of the inhibitors on Detroit 562 (A), FaDu (B) and SCC25 (C) cell lines are shown. The IC50 curves of the effects of the afatinib on the three HNSCC cell lines are shown in a common diagram (D) for better comparison. (E) The IC50 values for the effects of the EGFR inhibitors on Detroit 562, FaDu and SCC25 cells. All data are represented as the mean ± SD of five independent measurements. The IC50 values (E) of the two inhibitors were compared to each other and Student’s t-tests were performed for statistically significant differences; * p < 0.05 afatinib vs. erlotinib and one afatinib-treated cell line vs. another.

