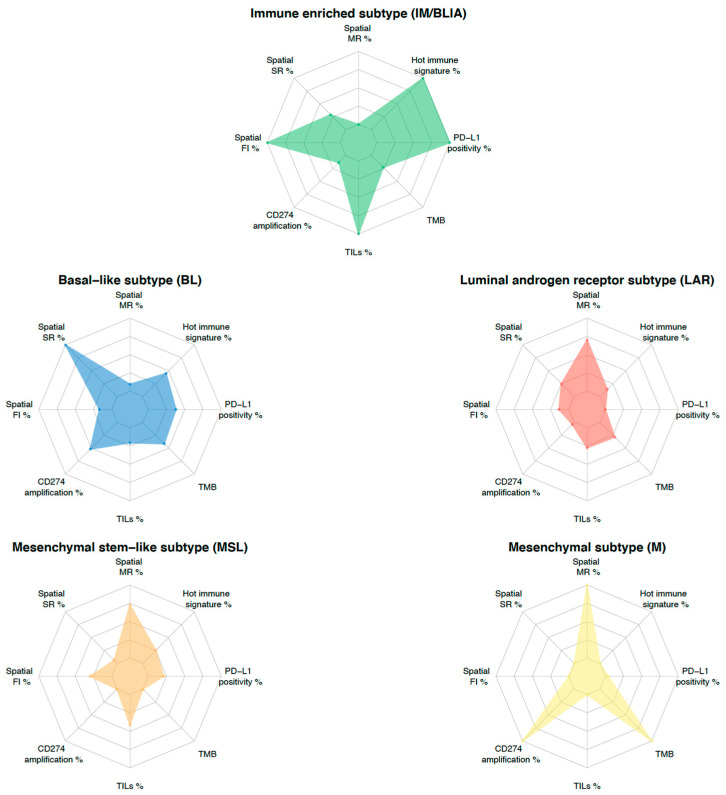
Figure 3.
TNBC molecular subtyping immunogram. The radar plot depicts eight parameters that characterize biomarkers potentially predicting a response to ICI-based therapy. Levels of each biomarker are rescaled between minimum (internal ring) and maximum value (external ring) for each parameter across subtypes. The contribution of each biomarker to TNBC molecular subtype is delineated by the connected colored line. Each subtype is represented by a specific color. Abbreviations. FI: fully inflamed, MR: margin-restricted (including immune desert), PD-L1: programmed death-ligand 1, SR: stroma-restricted, TILs: tumor infiltrating lymphocytes, TMB: tumor mutational burden (mut/Mb).

