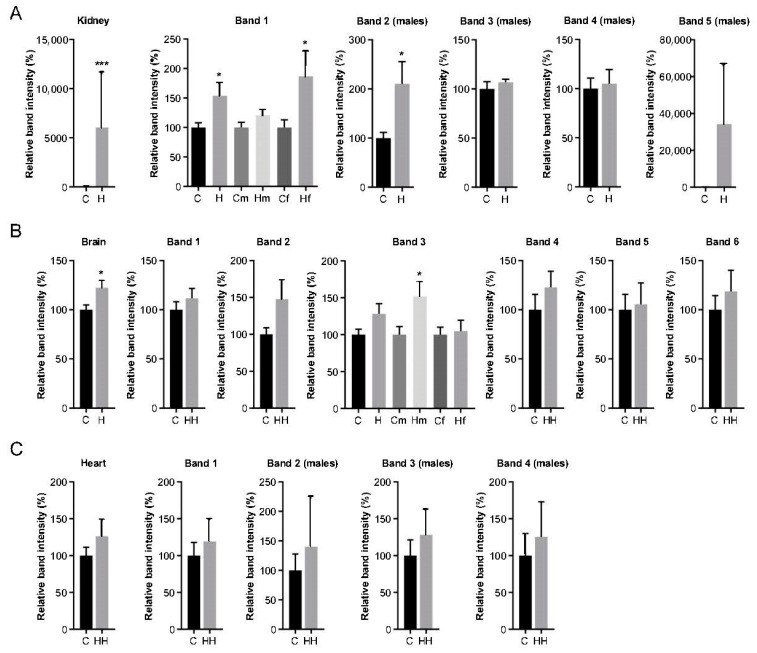
Figure 4.
Densitometric analyses of 4-hydroxynonenal (HNE)-protein signals. Global and individual intensities of bands as shown in Figure 3A and identified in Table 2 from (A) kidney, (B) brain and (C) heart of control (C) and Hfe−/− (H) mice. Analysis of male (m) and female (f) mice is shown separately only in cases of statistically significant results. When band analysis is shown for males only, it is indicated in brackets (males) at the top. Total Hfe−/− mice or control n = 18; male/female Hfe−/− or control mice n = 9. Values are expressed as relative band intensity (%) considering 100% the mean value of n = 18 control mice or n = 9 male/female control mice as indicated (mean ± SEM). Statistical comparisons were performed between groups using Student unpaired t-tests or Mann–Whitney U-tests. * p < 0.05, *** p ≤ 0.001.

