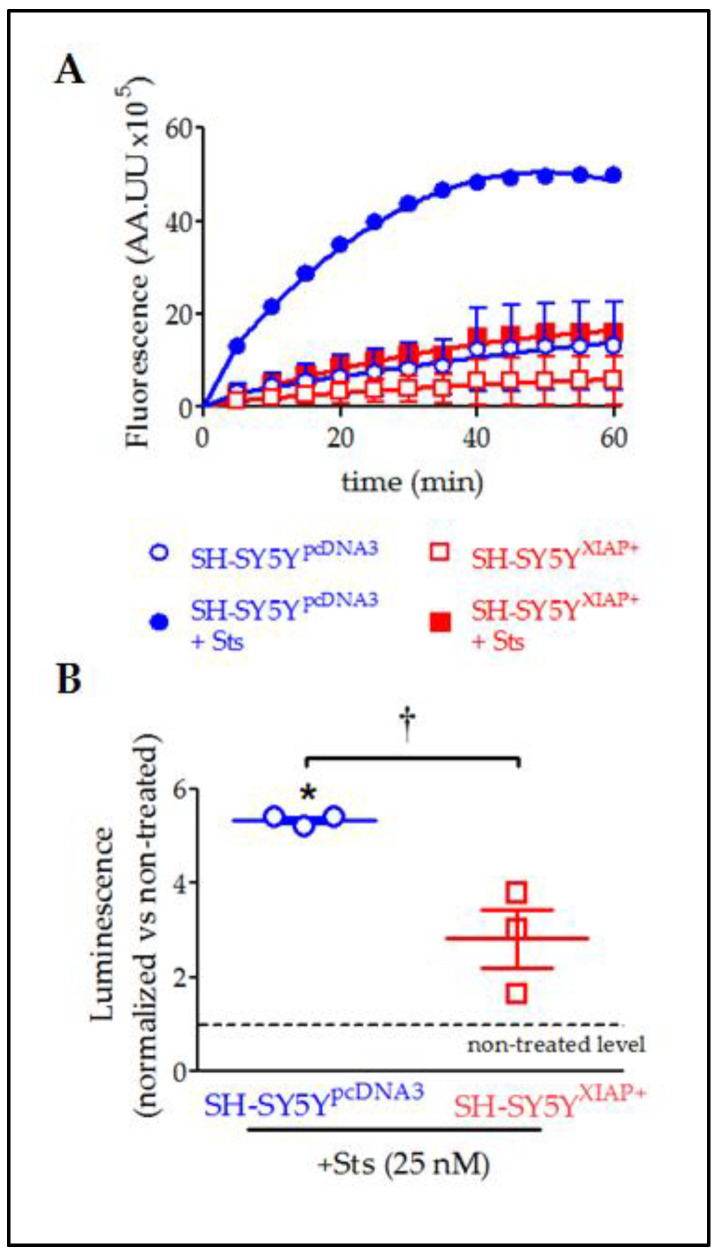
Figure 8.
Reduction in Sts-induced activation of CASP3/7 by overexpression of XIAP in SH-SY5Y cells. (A) Kinetics of CASP3/7 activity in both SH-SY5YpcDNA3 (blue symbols) and SH-SY5YXIAP+ cells (red symbols), treated at time 0 with Sts (filled symbols) or vehicle (empty symbols). (B) The dot plot summarises the Sts effect in CASP3/7 activity for SH-SY5YpcDNA3 (blue symbols) and SH-SY5YXIAP+ cells (red symbols). Data were normalised by non-treated levels (dot line) after 30 min (dot plot represents means ± SEM; * = p-value < 0.05 in paired Student’s t-test for Sts-treated SH-SY5YpcDNA3 vs. vehicle-treated cells; † = p-value < 0.05 in a two-way ANOVA of genetic background effect; n = 3 independent experiments).

