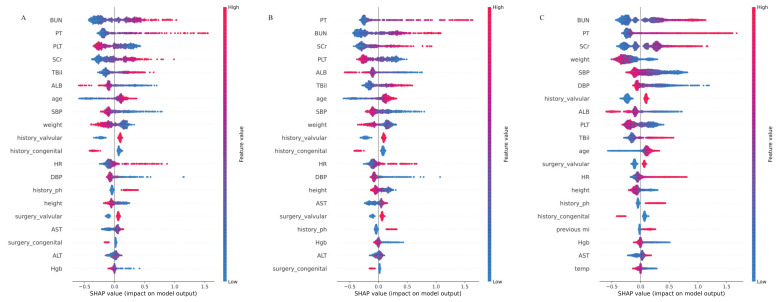
Figure 4.
The higher the SHAP value of a feature, the higher the probability of postoperative AKI development (X-axis is for the SHAP values, and the Y-axis is for the important features. Red represents higher feature values for positive influence, and blue represents lower feature values for negative impact). (A) The top 20 features of the CatBoostClassifier model in the development dataset by the SHAP model explainer. (B) The top 20 features of the CatBoostClassifier model in the validation dataset by the SHAP model explainer. (C) The top 20 features of the CatBoostClassifier model in the MIMIC-IV dataset by the SHAP model explainer.

