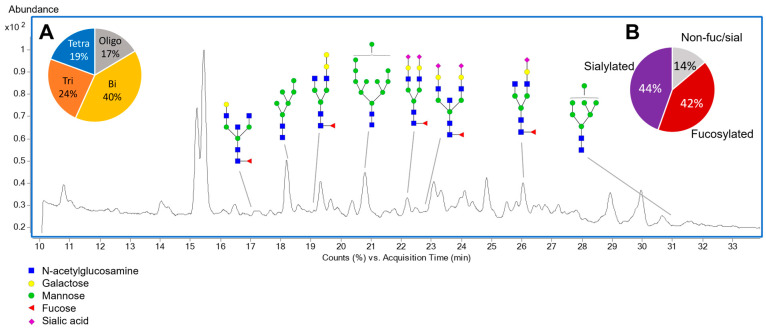
Figure 2.
Representative chromatogram of the brain N-glycan profile representing selected statistically significant structures in the three groups (CTRL, HFD, and MED). (A) Pie chart depicting the degree of the 72 N-glycans identified in hamster brain tissue. Oligo, oligomannose; Bi, biantennary; Tri, triantennary; Tetra, tetrantennary. (B) Pie chart depicting the percentage of fucosylated and sialylated N-glycans in hamster brain tissue. Non-fuc/sial, non-fucosylated and non-sialylated N-glycans. Structural symbols for the N-glycans are shown below the chromatogram.

