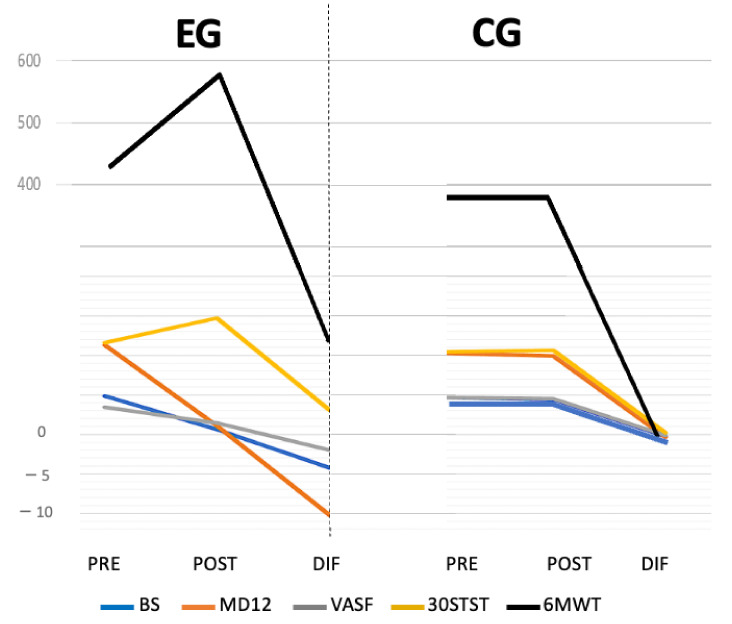
Figure 2.
Comparative graph of pre–post-intervention values and intergroup differences. EG: experimental group; CG: control group; PRE: pre-intervention; POST: post-intervention; DIF: Pre–post-intervention differences data; BS: Borg Scale; MD12: Multidimensional Dyspnea-12; VAFS: Visual Analog Fatigue Scale; 6MWT: Six-Minute Walking Test; 30STST: 30-Second Sit-to-Stand Test.

