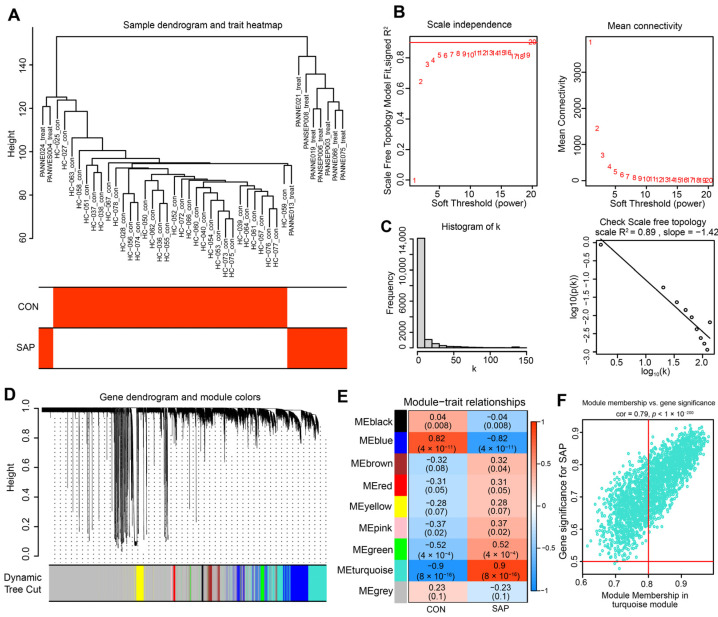
Figure 2.
Construction of the co-expression network. (A) The sample dendrogram and feature heat map were drawn based on the Euclidean distance using the average clustering method for hierarchical clustering of samples, with each branch representing a sample, Height in the vertical coordinate being the clustering distance, and the horizontal coordinate being the clinical grouping information. (B) Soft threshold (power = 20) and scale-free topology fit index (R2 = 0.89). (C) Histogram of connectivity distribution. The scale-free topology is checked at a soft threshold of 20. (D) Gene hierarchy tree-clustering diagram. The graph indicates different genes horizontally and the uncorrelatedness between genes vertically, the lower the branch, the less uncorrelated the genes within the branch, i.e., the stronger the correlation. (E) Heatmap showing the relations between the module and SAP features. The values in the small cells of the graph represent the two-calculated correlation values cor coefficients between the eigenvalues of each trait and each module as well as the corresponding statistically significant p-values. Color corresponds to the size of the correlation; the darker the red, the more positive the correlation; the darker the green, the more negative the correlation. (F) Scatter plot between gene salience (GS) and module members (MM) in turquoise.

