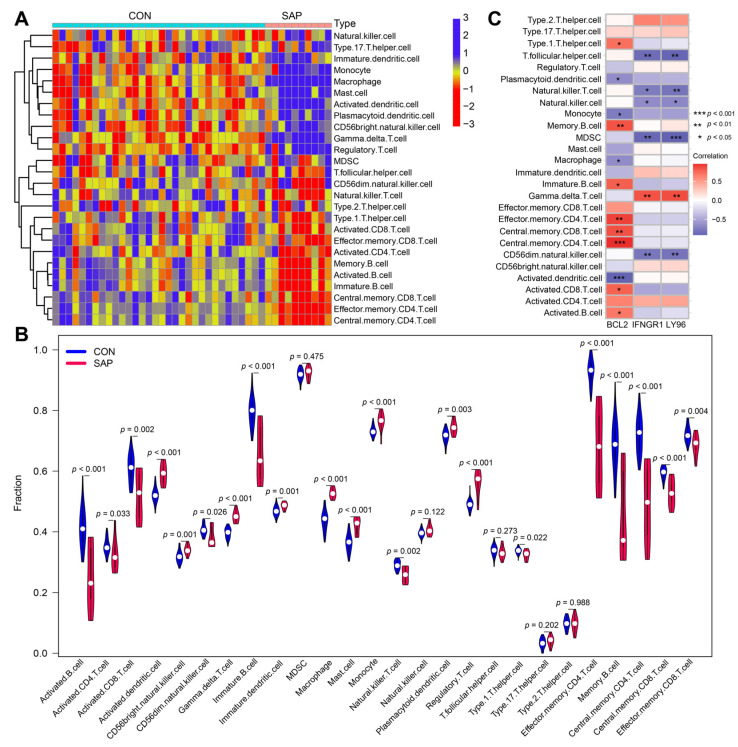
Figure 6.
Analysis of immune infiltration in SAP patient samples and its correlation with hub genes using ssGSEA. (A) Heat map showing the immune scores of 26 immune cells. Red indicates immune cell infiltration and blue indicates suppressed immune cells. (B) Violin plot showing immune scores of 26 immune cells in SAP patients and healthy controls. (C) Correlation between immune cell infiltration and three hub genes. * p < 0.05, ** p < 0.01, *** p < 0.001.

