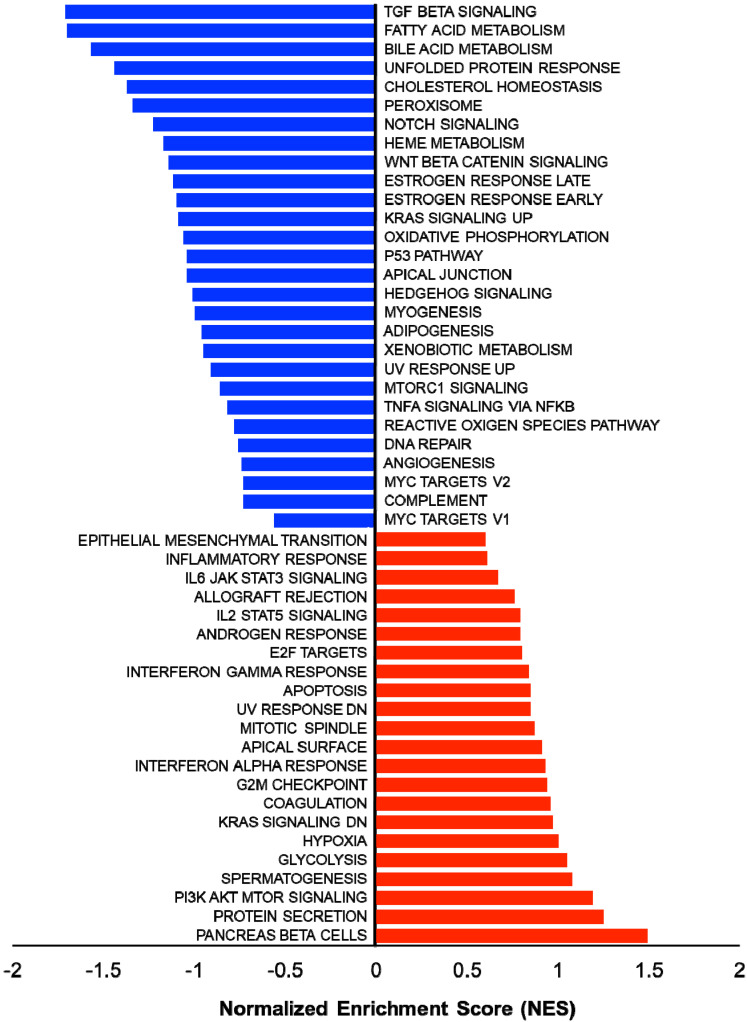
Figure 2.
Gene set enrichment analysis (GSEA) showing enriched gene sets of Rubcn KO and WT group comparison. Bars in red (positive NES) indicate significant enrichment in KO phenotype and bars in blue indicate WT phenotype (negative NES). Data source available fromGSE118019 [102].

