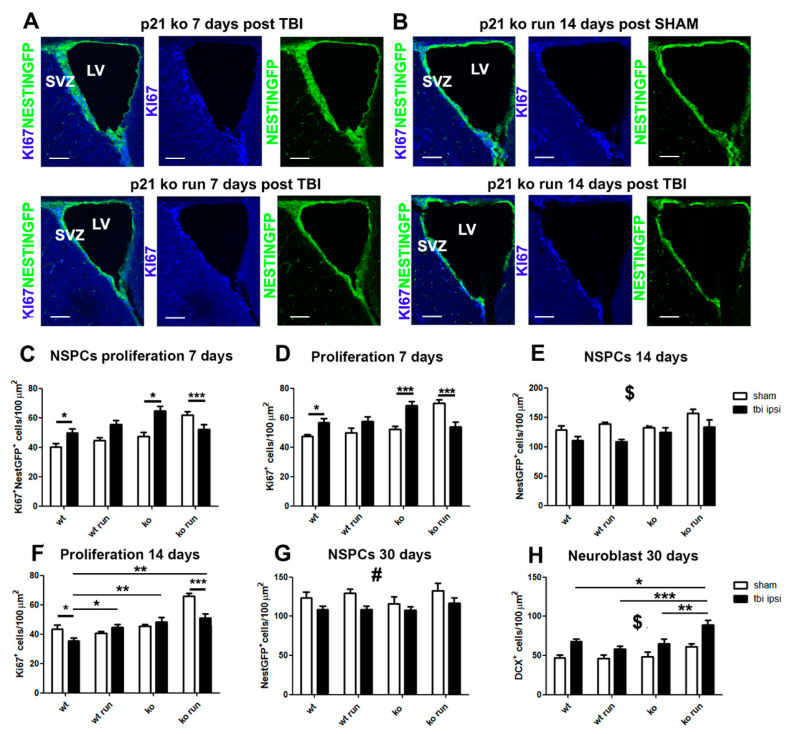
Figure 3.
Time course of NSPCs and type A neuroblast following TBI. (A) Micrographs show the decreased proliferation of neural stem/progenitor cells (NSPCs, Ki67+/NestinGFP+ cells) in the KO TBI RUN group with respect to the KO TBI mice at 7 days post TBI. (B) Representative pictures indicate the significantly decreased number of Ki67+/NestinGFP+ cells in the KO TBI RUN mice in comparison to their respective SHAM littermate 14 days after TBI. (C) Histograms show a significant increase in the proliferating NSPCs of WT TBI and KO TBI mice in comparison with their respective WT SHAM and KO groups (Ki67+ NestinGFP+ cells, ipsilateral: genotype x run x lesion interaction: F(1,112) = 11.71, p < 0.001, followed by LSD post-test, WT TBI vs. WT SHAM and KO TBI vs. KO SHAM p = 0.015). (D) Graph indicates a significant increase in the total proliferation of WT TBI and KO TBI mice with respect to the WT and KO SHAM groups (Ki67+ cells, genotype x run x lesion interaction, ipsilateral: F(1,108) = 14.38, p < 0.001, followed by LSD post-test, WT TBI vs. WT SHAM, p = 0.03, KO TBI vs. KO SHAM p < 0.001). (C,D) It is also possible to observe the decrease in the NSPCs proliferation of KO RUN TBI mice with respect to the KO RUN SHAM group (KO RUN TBI vs. KO RUN SHAM, p < 0.001, (C)) and total proliferation (KO RUN TBI vs. KO RUN SHAM, p < 0.001, (D)). (E) Graph displays the reduced proliferation of NSPCs in mice analyzed 14 days after TBI, when compared to their respective SHAM counterparts (NestinGFP+ cells, ipsilateral: lesion effect: F(1,105) = 17.21, p < 0.001, $). (F) Histogram shows the decreased total proliferation after 14 days after TBI in the WT TBI and KO RUN TBI mice with respect to their SHAM littermates (Ki67+ cells: genotype x run x lesion interaction: F(1,99) = 17.04, p < 0.001, followed by LSD post-test, WT TBI vs. WT SHAM, p = 0.029; KO RUN TBI vs. KO RUN SHAM p < 0.001). In the TBI groups, we detected a significant increase in proliferation in the WT RUN TBI mice (F(1,108) = 5.84, p = 0.017, followed by LSD post-test, WT TBI vs. WT RUN TBI, p = 0.01), as well as an increase in the KO TBI and KO RUN TBI mice (p < 0.01), in comparison with the WT TBI group. (G) Graph shows the decreased NSPC population in the ipsilateral SVZ of TBI mice with respect to their SHAM genotypes, 30 days after the TBI (NestinGFP+ cells: lesion effect: F(1,89) = 9.2, p = 0.003, #). (H) Histogram indicates at 30 days post TBI the increased number of neuroblasts (DCX+ cells) in the TBI group in comparison with their SHAM littermates (DCX+ cells, ipsilateral, lesion effect: F(1,53) = 20.7, p < 0.001, $). The comparison within the TBI groups (black histograms) show a significant increase in neuroblasts in the KO RUN TBI mice in comparison with WT TBI, WT RUN and KO TBI mice (genotype x run interaction: F(1,53) = 7.77, p = 0.007, followed by LSD post-test, KO RUN TBI vs. WT TBI = 0.015, vs. WT RUN TBI < 0.001, vs. KO TBI = 0.001, a, b, c, respectively). N = 5 mice/group. Statistical significance of LSD post hoc analysis: * p < 0.05, ** p < 0.01 and *** p < 0.001. Statistical significance of main lesion effect between SHAM and TBI groups: $ p < 0.001 and # p < 0.01. Multifactorial analysis with the following three independent variables: genotype, treatment and running, followed by Fisher’s LSD post hoc tests. Magnification = 20×. Scale bar = 100 μm. SVZ = subventricular zone. LV = lateral ventricle.

