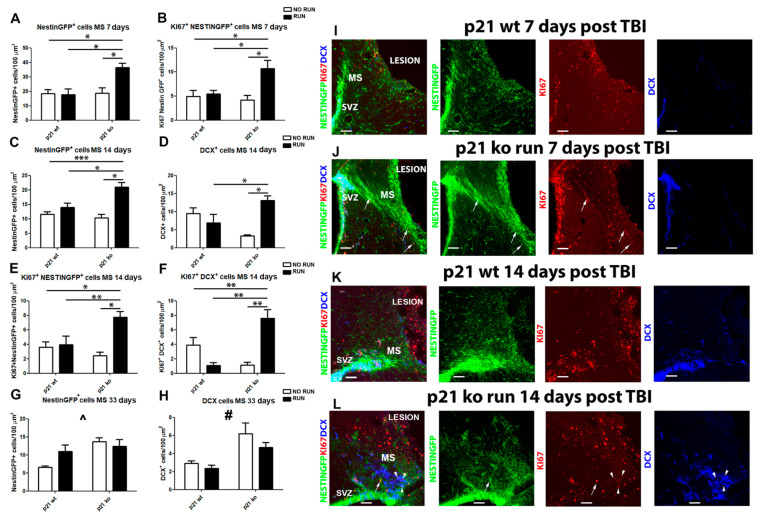
Figure 5.
Cell migration following TBI. (A) Graph shows the increase in the migratory stream (MS) of the KO RUN TBI mice in comparison to the other groups 7 days after the lesion of NestinGFP+ cells (genotype x running: F(1.18) = 5.98, p = 0.025, followed by LSD post-test, KO RUN TBI vs. WT TBI, p = 0.017, vs. WT RUN TBI, p = 0.031 and vs. KO TBI p = 0.027). (B) Graph shows the increase in proliferating NSPCs in the migratory stream (MS) of the KO RUN TBI mice 7 days after the lesion (Ki67+ Nestin GFP+ cells: genotype x running: F(1,18) = 5.51, p = 0.03, followed by LSD post-test, KO RUN TBI vs. WT TBI, p = 0.027, vs. WT RUN TBI, p = 0.038 and vs. KO TBI p = 0.049). (C) Histograms illustrate the enhancement in the MS of KO RUN TBI mice with respect to the other experimental condition 14 days after the TBI of NestinGFP+ cells (genotype x run interaction: F(1,18) = 6.55, p = 0.019, followed by LSD post-test, KO RUN TBI vs. WT TBI, p < 0.001, vs. WT RUN TBI, p = 0.01 and vs. KO TBI, p = 0.023). (D) Graph shows the increment, with respect to the other experimental conditions of DCX+ cells, in the MS of KO RUN TBI 14 days after TBI (genotype x run interaction: F(1,18) = 7.07, p = 0.016, followed by LSD post-test, KO RUN TBI vs. WT RUN TBI, p = 0.024 and vs. KO TBI, p = 0.02). (E) Graph shows the increase in the MS of KO RUN TBI mice with respect to the other groups 14 days after the TBI of proliferating NestinGFP+ (Ki67+/NestinGFP+: genotype x run interaction: F(1,18) = 5.07, p = 0.037, followed by LSD post-test, KO RUN TBI vs. WT TBI, p = 0.007, WT RUN TBI, p = 0.038 and vs. KO TBI, p = 0.0073). (F) Graph shows the increments, with respect to the other experimental conditions of proliferating DCX+ cells, in the MS of KO RUN TBI 14 days after TBI (Ki67+ DCX+ cells: genotype x run interaction: F(1,18) = 7.07, p = 0.016, followed by LSD post-test, KO RUN TBI vs. WT TBI, p = 0.004, WT RUN TBI, p = 0.008 and vs. KO TBI, p = 0.0018). (G) Graph indicates an increase in migrating NestinGFP+ cells in the KO TBI and KO TBI RUN mice with respect to the WT TBI mice 30 days after TBI (genotype effect: F(1,25) = 3.34, p = 0.011, ^). (H) Histograms show an enhancement of migrating DCX+ cells in the KO TBI and KO TBI RUN group with respect to the WT TBI mice 30 days after TBI (genotype effect: F(1.25) = 12.64, p = 0.0015, #). (I,J) Confocal micrographs show the increased density of migrating NestinGFP+ cells observed in the KO RUN TBI mice with respect to the WT TBI mice, 7 days from TBI. (K,L) Confocal micrographs illustrate the enhancement of NSPCs (NestinGFP+) and neuroblasts (DCX+) along the MS of the KO RUN TBI mice compared to the WT TBI group, 14 days post TBI. Arrow indicates the presence of proliferating NestinGFP+ cells and arrowheads indicate proliferating DCX+ cells. N = 5 mice/group. Statistical significance of LSD post hoc analysis: * p < 0.05, ** p < 0.01 and *** p < 0.001. Statistical significance of main genotype effect between WT and KO groups: # p < 0.01, ^ p < 0.05. Two-way ANOVA analysis followed by Fisher’s LSD post hoc tests. Magnification = 20×. Scale bar = 100 μm. SVZ = subventricular zone. MS = migratory stream.

