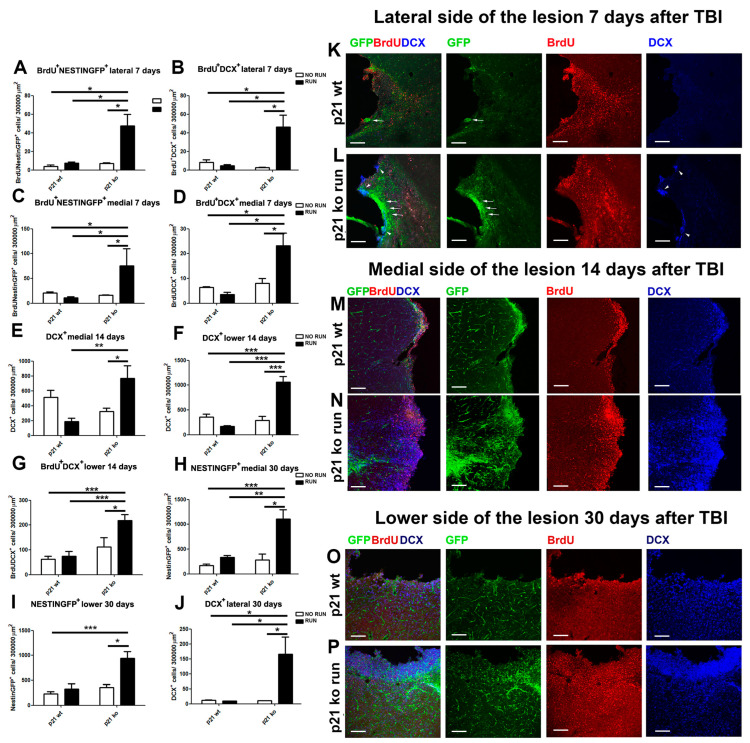
Figure 6.
Distribution of NSPCs and neuroblasts in the peri-lesion cortex. Seven days post TBI (A,C). Graphs show the increased density in the lateral (A) and medial (C) regions that border the cortical lesion of the KO RUN TBI mice of Brdu+NestinGFP+ cells (lateral, genotype x running: F(1,24) = 4.64, p = 0.041, followed by LSD post-test, KO RUN TBI vs. WT TBI, p = 0.02, vs. WT RUN TBI, p = 0.041 and vs. KO TBI p = 0.016, (A); medial, genotype X running: F(1,21) = 7.26, p = 0.013, followed by LSD post-test, KO RUN TBI vs. WT TBI, p = 0.04, vs. WT RUN TBI, p = 0.027 and vs. KO TBI p = 0.049, (C)). (B,D) Histograms illustrate in the lateral (B) and medial (D) peri-lesioned cortical area of the KO RUN TBI mice the enhanced BrdU+DCX+ cell density (lateral, genotype X running: F(1,21) = 7.32, p = 0.012, followed by LSD post-test, KO RUN TBI vs. WT TBI, p = 0.026, vs. WT RUN TBI, p = 0.015 and vs. KO TBI p = 0.011, (B); medial, BrdU+ DCX+: genotype X running: F(1,21) = 7.32, p = 0.012, followed by LSD post-test, KO RUN TBI vs. WT TBI, p = 0.026, vs. WT RUN TBI, p = 0.015 and vs. KO TBI p = 0.011, (D)). Fourteen days post TBI. (E,F,G) Graphs show, in the medial (E) and low (F) peri-injured cortical region of the KO RUN TBI, a significant increase in DCX+ cells (medial, genotype x run interaction: F(1,20) = 14.14, p = 0.0012, followed by LSD post-test, KO RUN TBI vs. WT RUN TBI, p = 0.007 and vs. KO TBI, p = 0.03, (E) and low (genotype x run interaction: F(1,20) = 7.52, p = 0.012, followed by LSD post-test, KO RUN TBI vs. WT TBI and WT RUN TBI, p < 0.001, vs. KO TBI, p = 0.03, (F)), as well as an increase in BrdU+DCX+ cells in the low side ((G), genotype x run interaction: F(1,20) = 7.52, p = 0.012, followed by LSD post-test, KO RUN TBI vs. WT TBI and WT RUN TBI, p < 0.001, vs. KO TBI, p = 0.03). Thirty days post TBI. (H,I) Histograms illustrate the significant increment in the KO RUN TBI group of NestinGFP+ cells in the medial (H) and low (I) regions (medial: genotype x run interaction: F(1,15) = 8.26, p = 0.011, followed by LSD post-test, KO RUN TBI vs. WT TBI, p < 0.001, vs. WT RUN TBI, p = 0.008, vs. KO TBI, p = 0.01, (H); low: genotype x run interaction: F(1,15) = 6.71, p = 0.02, followed by LSD post-test, KO RUN TBI vs. WT TBI, p < 0.001, vs. WT RUN TBI and KO TBI p = 0.01, (I)). (J) Graph shows the increase in DCX+ cells in the lateral cortical regions of KO RUN TBI mice, 30 days after TBI (genotype x run interaction: F(1,15) = 6.51, p = 0.022, followed by LSD post-test, KO RUN TBI vs. WT TBI, p = 0.015, vs. WT RUN TBI, and KO TBI, p = 0.047). (K,L) Confocal representative pictures show the specific localization of NestinGFP+ (arrows) and DCX+ (arrowheads) cells in the lateral cortical region lining the lesion of the KO RUN TBI mice, at 7 days post TBI (K). At the same time-point in the WT TBI group, we observe only a limited number of NestinGFP+ (arrow) cells in the peri-lesioned lateral side. (M,N) Confocal representative micrographs show that after 14 days from TBI, it is possible to observe in the medial side of the lesion of KO RUN TBI mice (M) a high density of NestinGFP+ (green), and DCX+ (blue) cells co-localizing with BrdU (red). In the same area of the WT TBI (N) mice, we detect a much lower density of cells. (O,P) The confocal pictures show the accumulation of DCX+ and BrdU+DCX+ cells in the low cortical peri-lesion area of the KO RUN TBI mice (P), which is not detectable in the WT TBI group (O). N = 5 mice/group. Statistical significance: * p < 0.05, ** p < 0.01 and *** p < 0.001. Two-way ANOVA analysis and Fisher’s LSD post hoc tests. Magnification = 20×. Scale bar = 100 μm.

