Figure 7.
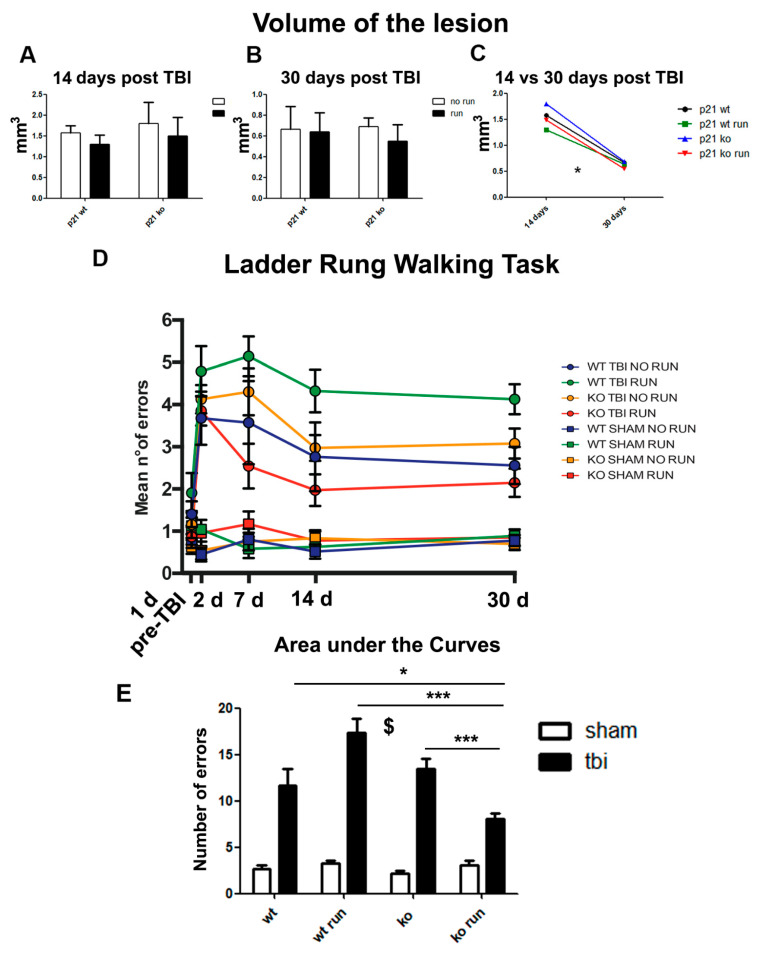
Anatomical and functional recovery following TBI. (A,B) Graphs show the average volumes of the lesions 14 (A) and 30 (B) days after the TBI procedure in the four experimental groups. (C) Histograms indicate the decreased average volumes of the lesions from 14 to 30 days post TBI in the four different experimental conditions (time effect: F(4,28) = 22.08; p < 0.05). (D) The graph indicates the mean number of errors per group at each time point. The same color shows an experimental condition and its relative SHAM control. The statistical analysis evidenced significant effects of the time variable (time effect F = 9.949 p < 0.05, Figure 7D). Within the TBI groups, we found that at 7 days post TBI, the KO RUN TBI animals demonstrated better performances with respect to the other conditions and, notably, a number of mistakes comparable to their SHAM control time effect (P7: genotype x run interaction: F(1,64) = 7.65 p = 0.032, followed by LSD post-test, KO RUN TBI vs. WT TBI, WT RUN TBI and KO TBI, p < 0.001). For the statistical analyses of the volumes of the lesions, we performed a multifactorial analysis with the following three independent variables: genotype; running and time. (E) The histograms represent the area under the curve analysis and show the increase in errors in the TBI groups (lesion effect F(1,48) = 153; p < 0.001, $); moreover, in the TBI groups, the statistical analysis indicates a decrease in errors in the KO RUN TBI mice in comparison with the other TBI groups (genotype x run x lesion interaction, F(1,48) = 12.92, p < 0.001, followed by LSD post-test, KO RUN TBI vs. WT TBI, p = 0.011, vs. WT RUN TBI, and KO TBI, p < 0.001). The behavioral data of the Ladder Rung Walking task have been analyzed by a multifactorial analysis with the following four independent variables: genotype, running, time and the treatment. The area under the curve statistics were evaluated by multifactorial analysis with the following three independent variables: genotype, treatment and running. (N = 8 mice/group). The post hoc analyses have been conducted via by Fisher’s LSD post hoc tests. Statistical significance: * p < 0.05 and *** p < 0.001.

