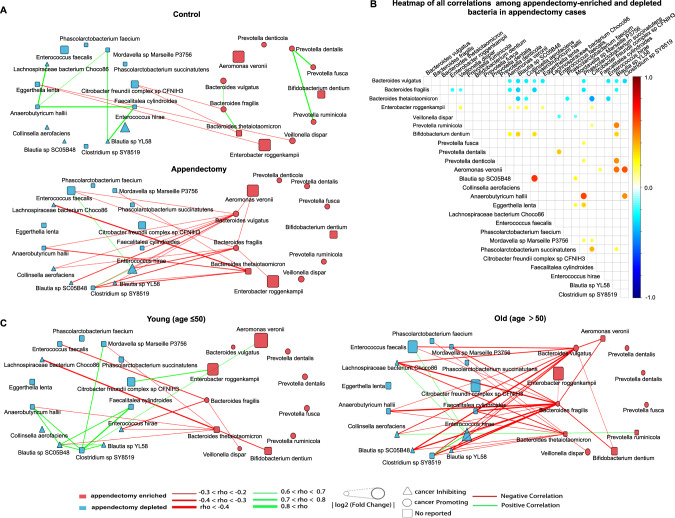
Fig. 4. Correlation analysis of differential abundant bacteria species.
A Correlation network among differential abundant species (enriched/depleted) selected by LEfSe in appendectomy and control groups. B Heatmap for all stronger relationships in appendectomy cases among appendectomy-enriched/depleted bacteria. The node size in the heatmap represented Spearman’s rank correlation coefficient. C Subgroup analysis (age ≤50/ age > 50 years) of associations in appendectomy cases among selected bacteria with correlation coefficient rho below −0.2 or above 0.6 are shown. Correlations were calculated by Spearman’s rank correlation. The node size in the networks represents log2 (Fold Change). The red lines represent co-exclusion correlation, and green lines represent co-occurrence association. Species that were reported to promote cancer were marked in red fonts, while the cancer-inhibiting species were marked in blue fonts.

