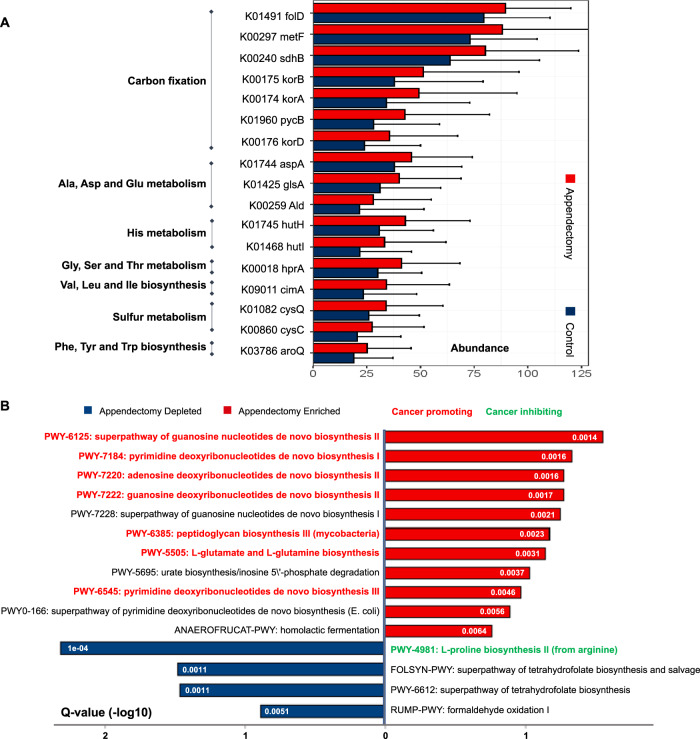
Fig. 5. Microbiome functional capacity changes in appendectomy patients.
A Appendectomy-induced alteration of abundance in microbial genes was summarized by KEGG pathway modules. The genes enriched in appendectomy compared to normal control were evaluated for gene relative abundance profiles (Wilcoxon rank-sum test followed by FDR correction using “Benjamini–Hochberg” methods, q < 0.1), and those with mean relative abundance >1% were shown. The relative gene abundance was shown as bar plots by averaging all appendectomy samples (n = 157). B Bar plot for Pathway Enrichment Analysis by Humann2 with Meta-Cyc database. The red bar standard for appendectomy-enriched pathways compared with control group, whist the blue bar represented the appendectomy-depleted pathways. Pathways reported to promote cancer were marked in red fonts, and the cancer-inhibiting ones were marked in green fonts.

