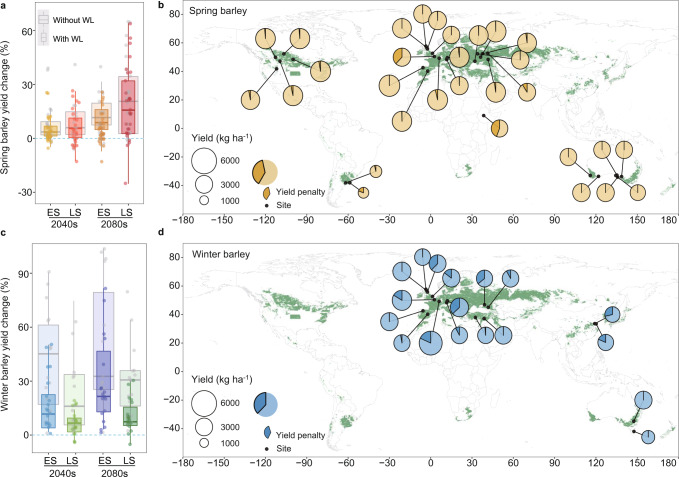
Fig. 2. Impacts of waterlogging on yield under future climates (2040, 2080) relative to the historical baseline (1985–2016) for early and late sowing (ES, LS).
a, c Simulated yield differences under future climates with and without waterlogging (WL) for genotypes with early (spring sowing barley) or late maturity (autumn/winter sowing barley). b, d Simulated yields (pie charts; dark segments denote yield penalty) under late sowing for spring barley and early sowing for winter barley in 2040 (results for early or late sowing in 2040 and 2080 can be found in supplementary Fig. 12). Yields were simulated with APSIM using downscaled projections from 27 GCMs (n = 27). Boxplots indicate simulated yield change across sites and GCMs; box boundaries indicate 25th and 75th percentiles, whiskers below and above each box denote the 10th and 90th percentiles, respectively. Green regions in the maps define predominant barley cropping areas. The map was modified using R package ggplot2’maps (version 3.4.0)’ with the Natural Earth dataset in a publica domain (https://www.naturalearthdata.com).

