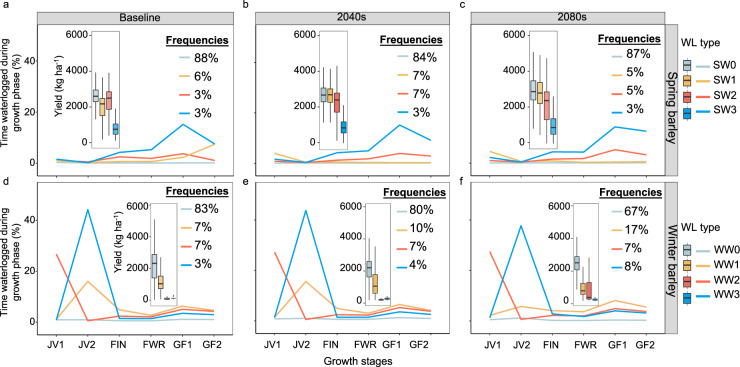
Fig. 3. Waterlogging (WL) stress patterns and frequencies and grain yields for the baseline (1985–2016), 2040 (2030–2059) and 2080 (2070–2099).
Data shown for spring (a–c) and winter barley (d–f) across sites, sowing times and genotypes. Four key waterlogging stress patterns across sites and genotypes are depicted: stress patterns for spring barley include SW0 (minimal waterlogging); SW1 (low moderate-late waterlogging); SW2 (late-onset moderate waterlogging); SW3 (late-onset severe waterlogging) and winter barley WW0 (minimal waterlogging); WW1 (low early-onset waterlogging relieved later); WW2 (moderate early-onset waterlogging); WW3 (severe early-onset waterlogging). Boxplots indicate grain yields for spring and winter barley across sites and GCMs; box boundaries indicate the 25th and 75th percentiles across 27 GCMs, whiskers below and above the box indicate the 10th and 90th percentiles. Growth stages include the early juvenile phase (JV1, 10 <= APSIM growth stage <21; late juvenile phase (JV2, 21 <= APSIM growth stage <32); floral initiation to heading (FIN, 32 <= APSIM growth stage <65); flowering to grain filling (FIN, 65 <= APSIM growth stage <71; early grain filling (GF1, 71 <= APSIM growth stage <80) and late grain filling (GF2, 80 <= APSIM growth stage <87).

