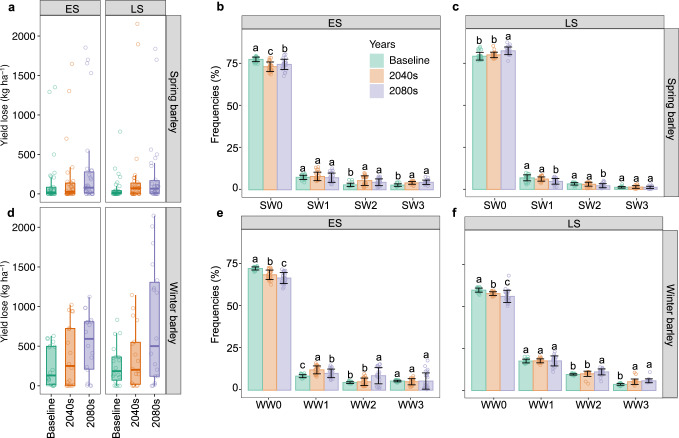
Fig. 4. Grain yield penalty and waterlogging stress patterns for the baseline (1985–2016), 2040 (2030–2059) and 2080 (2070–2099).
Grain yield penalties are shown for spring (a) and winter (d) barley across sites and genotypes for relatively early or late sowing (ES, LS) at each site. Boxplots indicate yield penalty for spring and winter barley across sites and GCMs (n = 27); box boundaries indicate 25th and 75th percentiles, whiskers below and above the box indicate the 10th and 90th percentiles, respectively. Waterlogging stress patterns for spring barley include SW0 (minimal waterlogging); SW1 (low moderate-late waterlogging); SW2 (late-onset moderate waterlogging); SW3 (late-onset severe waterlogging) and winter barley, WW0 (minimal waterlogging); WW1 (low early-onset waterlogging relieved later); WW2 (moderate early-onset waterlogging); WW3 (severe early-onset waterlogging). Data in (b), (c), (e) and (f) are presented as mean ± standard errors of the mean of GCMs (n = 27). Data were analysed using one-way analysis of variance followed by least significant difference (LSD) post-hoc tests. Different letters in (b), (c), (e) and (f) above the bars indicate significant differences in the frequency of stress patterns between climate periods (P < 0.05). Exact P values include: 4.96e-08 (SW0 for ES in spring barley), 0.46 (SW1 for ES in spring barley), 1.47e-04 (SW2 for ES in spring barley), 2.61e-08 (SW3 for ES in spring barley), 7.44e-07 (SW0 for LS in spring barley), 2.88e-05(SW1 for LS in spring barley), 5.39e-04 (SW2 for LS in spring barley), 0.49 (SW3 for LS in spring barley), 1.42e−11 (WW0 for ES in winter barley), 2.30e-08 (WW1 for ES in winter barley), 5.66e-06 (WW2 for ES in winter barley), 0.84 (WW3 for ES in winter barley), 3.97e-07 (WW0 for LS in winter barley), 0.97 (WW1 for LS in winter barley), 4.93e-04 (WW2 for LS in winter barley) and 6.01e-09 (WW3 for LS in winter barley).

