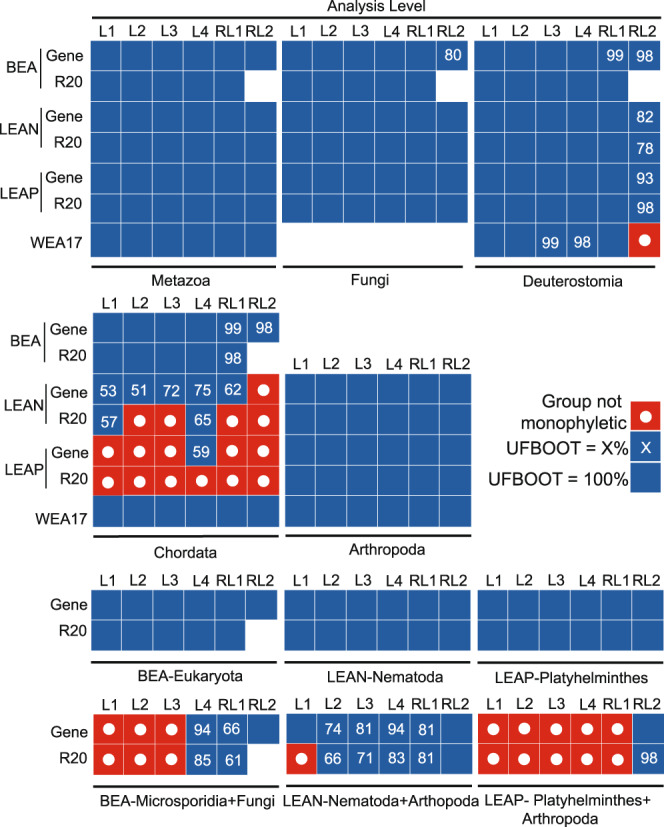
Fig. 1. Inference of benchmark relationships following phylogenetic approaches used by Redmond and McLysaght1 with partitioning by gene and partitioning using 20% relaxed clustering.

Dataset and analysis level abbreviations follow Redmond and McLysaght1. “Gene” and “R20” reflect whether the analysis was partitioned by gene or by using 20% relaxed clustering. L1, L2, L3, and L4 are non-recoded analyses with increasing use of site-heterogenous models (see methods of RM). RL1 is recoded analyses without site-heterogeneous models and RL2 is recoded analyses with site heterogeneous models. Solid blue boxes indicate 100% ultrafast bootstrap (UFBOOT) support for the relationship labelled under each set of boxes (e.g., “Metazoa”, “Fungi”). Numbers represent ultrafast bootstrap support less than 100%. Red boxes with dots indicate that a relationship was not recovered. Analysis RL2 for BEA is not reported as IQTREE 1.6.12 tree inference failed because of an error, likely resulting from overparameterization.
