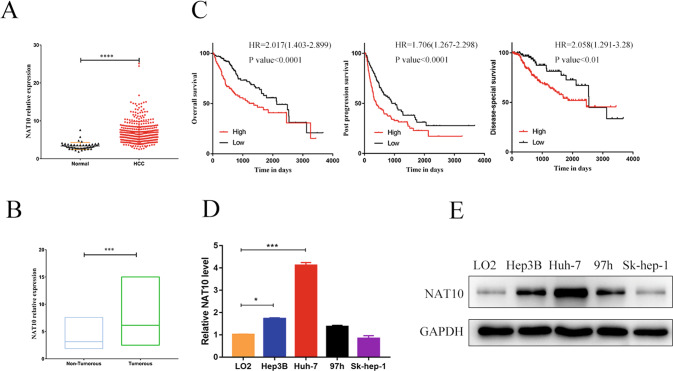
Fig. 1. NAT10 was highly expressed in HCC and associated with a worse prognosis.
A TCGA STAD dataset analysis showed that the expression of NAT10 in HCC patients was significantly higher than that in healthy people (P < 0.0001). B GEO database (GSE 7186) was used to evaluate the expression of NAT10 in HCC tissues and corresponding adjacent tissues (n = 50), and the expression of NAT10 in cancer tissues significantly upregulated P < 0.001). C Kaplan–Meier analysis showed that the OS, PPS, and DSS of HCC patients with high NAT10 expression were significantly lower than those with low NAT10 expression. D qRT-PCR showed that the expression levels of Huh-7 and Hep3B NAT10 in four HCC cell lines were significantly upregulated compared with those in normal hepatocytes LO2. E Protein analysis of NTA10 in LO2 and different HCC cell lines by Western blot showed significant expression of NAT10 protein in Hep3b and Huh-7. Each experiment was performed in triplicate, and data are shown as mean ± standard deviation. *P < 0.05, **P < 0.01, ***P < 0.001.

