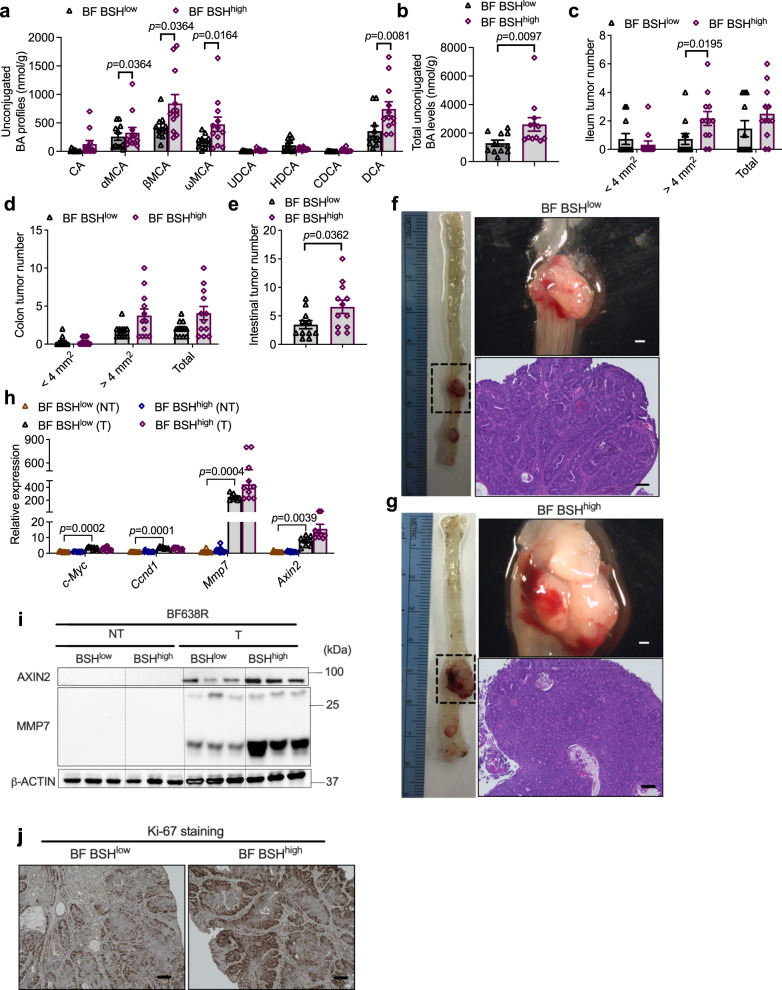
Fig. 5. Microbial BSH overexpression in B. fragilis potentiates CRC progression.
a–h HFD-fed Cdx2Apcf/w mice were colonized with BF BSHlow or BF BSHhigh for 12 weeks (n = 11 mice for BF BSHlow; n = 12 mice for BF BSHhigh). Unconjugated bile acid profiles (a) and total unconjugated bile acid levels (b) in the colon contents. Mann–Whitney U test with two-sided (a). Two-tailed Student’s t test (b). The ileum (c) and colon (d) tumor incidence, and tumor numbers with different sizes (<4 mm2, >4 mm2 and the sum of both. Mann–Whitney U test with two-sided. e Total tumor numbers in the intestine. Two-tailed Student’s t test. f, g Representative pictures of colon (left), gross images of tumors (top right) in the colon and H&E staining (bottom right) of colon tumor sections. Scale bars: 1.5 mm (top right) and 100 μm (bottom right). h Relative mRNA levels of WNT target genes in colon non-tumor (NT) and tumor (T) tissues (n = 10 for BF BSHlow-NT; n = 12 for BF BSHhigh-NT; n = 8 for BF BSHlow-T; n = 10 for BF BSHhigh-T). Kruskal–Wallis test with Dunn’s post hoc test. i WB data of proteins involved in WNT signaling (n = 3 independent samples/group). j Representative IHC staining of Ki-67 (n = 8 independent slides for BF BSHlow; n = 9 independent slides for BF BSHhigh). Scale bars: 100 μm. Data are presented as mean values +/− SEM in (a–e, h). Source data are provided as a Source Data File for Fig. 5.

