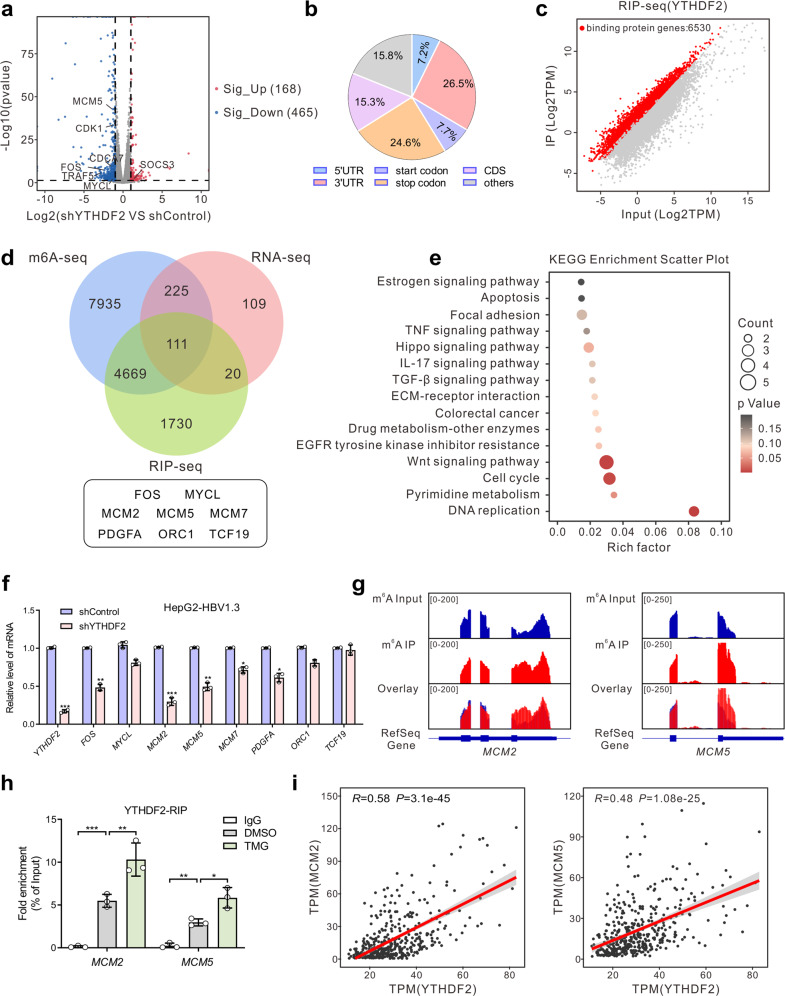
Fig. 5.
Identification of YTHDF2 targets by high-throughput RNA-seq, m6A-seq and RIP-seq. a Volcano plot of RNA-seq results in shControl and shYTHDF2 HBV-infected HepG2 cells. Blue and red dots indicate |log2FC | ≥ 1 and P-value ≤ 0.05. b Graphs of m6A peak distribution showing the proportion of total m6A peaks in the indicated regions in HBV-infected HepG2 cells. c Scatter plot of YTHDF2 RIP-seq (IP versus Input) in HBV-infected HepG2 cells. Red dots represent genes that are differentially upregulated or YTHDF2-binding genes, and gray dots represent genes that are not differentially expressed or differentially downregulated. d Venn diagram illustrating the overlapped targets of RNA-seq (downregulated upon YTHDF2 knockdown), m6A-seq and RIP-seq. e KEGG enrichment analysis of overlapped differentially expressed genes (DEGs) identified by RNA-seq, m6A-seq and RIP-seq. f Relative mRNA levels of initial screening genes in HepG2-HBV1.3 cells identified by RT-qPCR (n = 3, performed in triplicate). g Distribution of m6A peaks across MCM2 (left) and MCM5 (right) transcripts. h YTHDF2-RIP-qPCR showing the association of MCM2 or MCM5 transcripts with YTHDF2 in HepG2-HBV1.3 cells (n = 3, performed in triplicate). i Correlation analysis between YTHDF2 and MCM2 (left), or YTHDF2 and MCM5 (right) in TCGA-LIHC cohort (Pearson correlation, P < 0.001). Data are represented as mean ± SD. For f and h, data were analyzed by one-way ANOVA followed by Tukey’s test, *P < 0.05, **P < 0.01, ***P < 0.001

