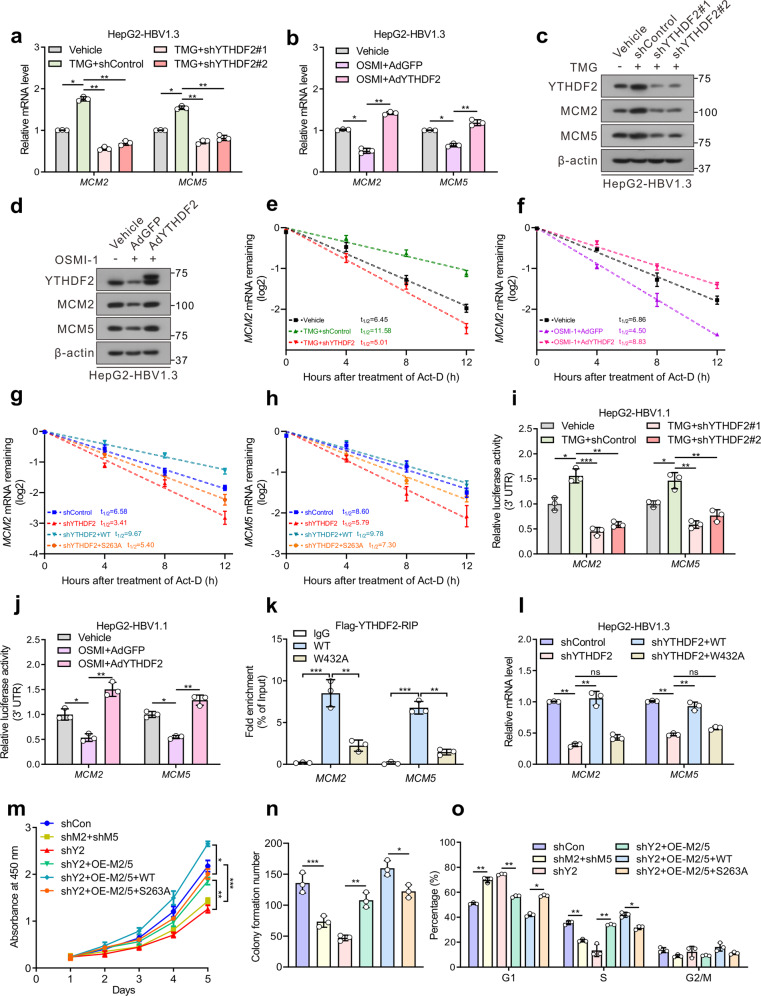
Fig. 6.
YTHDF2 stabilizes cell cycle-related gene MCM2 and MCM5 to promote HCC proliferation. a–d Relative mRNA levels (a, b) or immunoblots (c, d) of MCM2 and MCM5 (MCM2/5). HepG2-HBV1.3 cells (AdHBV1.3 infected) were treated with 25 μM TMG, and followed by transfected with control or two individual YTHDF2 shRNAs (a, c) or treated with 20 μM OSMI-1, and infected with adenoviruses expressing Flag-YTHDF2 (AdYTHDF2) or control (AdGFP) (b, d). For a and b, experiments are performed in triplicate, n = 3. e, f Lifetime of MCM2 mRNA in HepG2-HBV1.3 cells treated with 25 μM TMG, and followed by transfected with control or YTHDF2 shRNA (e) or treated with 20 μM OSMI-1, and infected with AdGFP or AdYTHDF2 (f). g, h Lifetime of MCM2/5 mRNA in HepG2-HBV1.3-shYTHDF2 cells transfected with Flag-tagged YTHDF2 (WT or S263A). Transcription was inhibited by actinomycin D (5 μg/mL) (n = 3, performed in triplicate). i, j Relative luciferase activity of constructs containing 3’UTR of MCM2 or MCM5 in HepG2-HBV1.1 cells (pCH9/3091 transfected) (n = 3, performed in triplicate). k, l HepG2-HBV1.3 cells were transfected with control or YTHDF2 shRNA lentiviral vector, and subsequently transfected with Flag-tagged YTHDF2 (WT or W432A). Flag-RIP-qPCR (k) showed the interaction of MCM2/MCM5 transcripts with YTHDF2. RT-qPCR (l) showed the relative MCM2/5 mRNA levels (n = 3, performed in triplicate). m–o Cell proliferation (m), colony formation (n) and flow cytometric analysis (o) in HepG2-HBV1.3 cells, which were transfected with control (shCon), or YTHDF2 shRNA lentiviral vector (shY2) or MCM2 and MCM5 shRNA lentiviral vectors (shM2 + shM5) to knock down endogenous YTHDF2 or MCM2/MCM5. Then shYTHDF2 groups were subsequently overexpressed with MCM2 and MCM5 (shY2+OE-M2/5), with (or without) overexpression of WT/S263A YTHDF2. All the experiments were performed in HBV-infected cells (n = 3, performed in triplicate). Data are represented as mean ± SD. For a, b and e–o, data were analyzed by one-way ANOVA followed by Tukey’s test, *P < 0.05, **P < 0.01, ***P < 0.001

