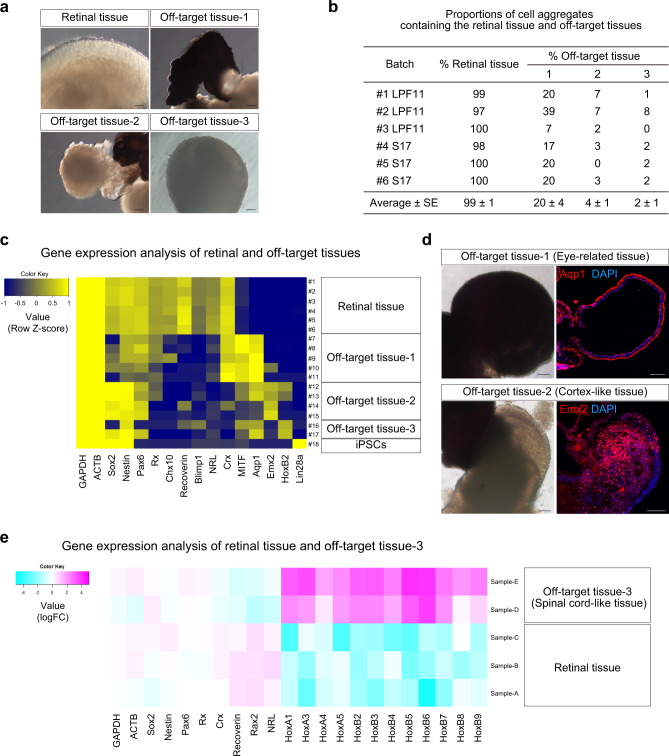
Fig. 2. Characterization of major off-target tissues in the retinal differentiation culture.
a Bright-field view of retinal tissue and off-target tissues in iPSC-LPF11-derived cell aggregates. Scale bar: 100 µm. b Proportions of cell aggregates containing retinal tissue and off-target tissues. Three independent batches derived from iPSC-LPF11 cells and three independent batches derived from iPSC-S17 cells were analyzed (n = 59–95 aggregates per each batch). Data are presented as mean ± SE. c Heat map for gene expressions in retinal tissue and off-target tissues derived from iPSC-LPF11 cells. As a control, gene expressions in undifferentiated iPSC-LPF11 cells are also shown. Gene expressions were measured by qPCR analyses. Row Z-scores were calculated for each tissue and plotted as a heat map. d Representative bright-field images and IHC images for off-target tissue-1 and -2 derived from iPSC-LPF11 cells. The bright-field images and IHC images were captured at the same positions. Immunostaining for Aqp1 (upper right; red) and Emx2 (lower right; red) is shown. Blue: nuclear staining with DAPI. Scale bar: 100 µm. e Heat map for gene expressions in retinal tissue and off-target tissue-3 derived from iPSC-1231A3 cells. mRNA levels were determined by microarray analysis. LogFC values were calculated for each gene and plotted as a heat map. FC, fold change. Note that off-target tissue-3 expressed Hox genes compared with retinal tissue.

