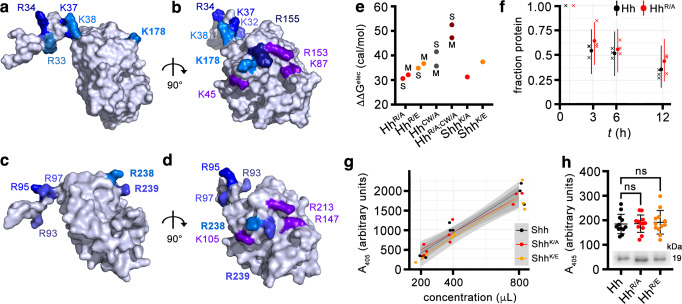
Fig. 1. Two HS-binding sites in Shh and modeled Drosophila melanogaster Hh.
a–d The first established HS-binding site (the Cardin-Weintraub (CW) motif) of Shh (a, b, pdb: 3m1n) or of D. melanogaster Hh (c, d) is located at the N-terminal extension of one monomer (left in a, c and top in b, d), whereas the second site comprises residues on the globular domain. HS-binding basic residues are in different shades of blue and residues that also bind to Ptc receptors are in violet. Both HS-binding sites are far from each other in the monomeric structures, with a median distance of ~2.7 nm. See Supplementary Tables 1, 2 for details. e In silico analysis of the effect of mutations in wild-type Drosophila HhNΔ251–257 and human ShhNΔ191–197 on the electrostatic contribution to the binding affinity against a heparin disaccharide. ΔΔGelec values express the difference of ΔGelec between each mutant protein and its corresponding wild-type protein. In Hh, both the CW domain and globular domain contribute to heparin binding. In both Shh and Hh, the globular glutamate variants have a lower affinity to heparin than the alanine variants. Annotations M and S distinguish results based on different template structures of protein (Electrostatic calculations in Methods, Source data are provided as a Source Data file). f Remaining fraction of Hh (black) and HhR/A (red) after 0, 3, 6, and 12 h. Crosses correspond to measured data with small shifts along the time axis used to separate points for clarity. Dots and uncertainty bar mark mean fractions estimated with a Bayesian model (see supplementary information), with the dot marking the median estimate and the uncertainty bars covering 5 to 95% quantiles. As the uncertainty bars have large overlaps, we cannot distinguish the decay dynamics of Hh and HhR/A with confidence. Raw data and 5 to 95% quantiles are provided as Source Data file. g A405 measurements for each of the three protein variants (color legend) at three different concentrations are shown as dots. A random jitter in the horizontal direction was added to avoid overplotting. The three lines correspond to linear models fitted with the data of the respective proteins. 95%-confidence ribbons (gray areas) for the linear models largely overlap, indicating that courses of data for different proteins cannot be distinguished with confidence. Raw data and 95%-confidence ribbons are provided as Source Data file. h Hh, HhR/A, and HhR/E induce Hh-specific differentiation of C3H10T1/2 reporter cells to similar degrees, confirming that the arginines do not contribute to Ptc receptor binding. Inset: similar amounts of Hh variants were used in this experiment. One-way ANOVA, Dunnett’s multiple comparisons test, n = 12 for each set. Error bars represent standard deviation. F = 0.098. p = 0.9. Source data, means and p values (n.s.: p > 0.05) are provided as Source Data file.

