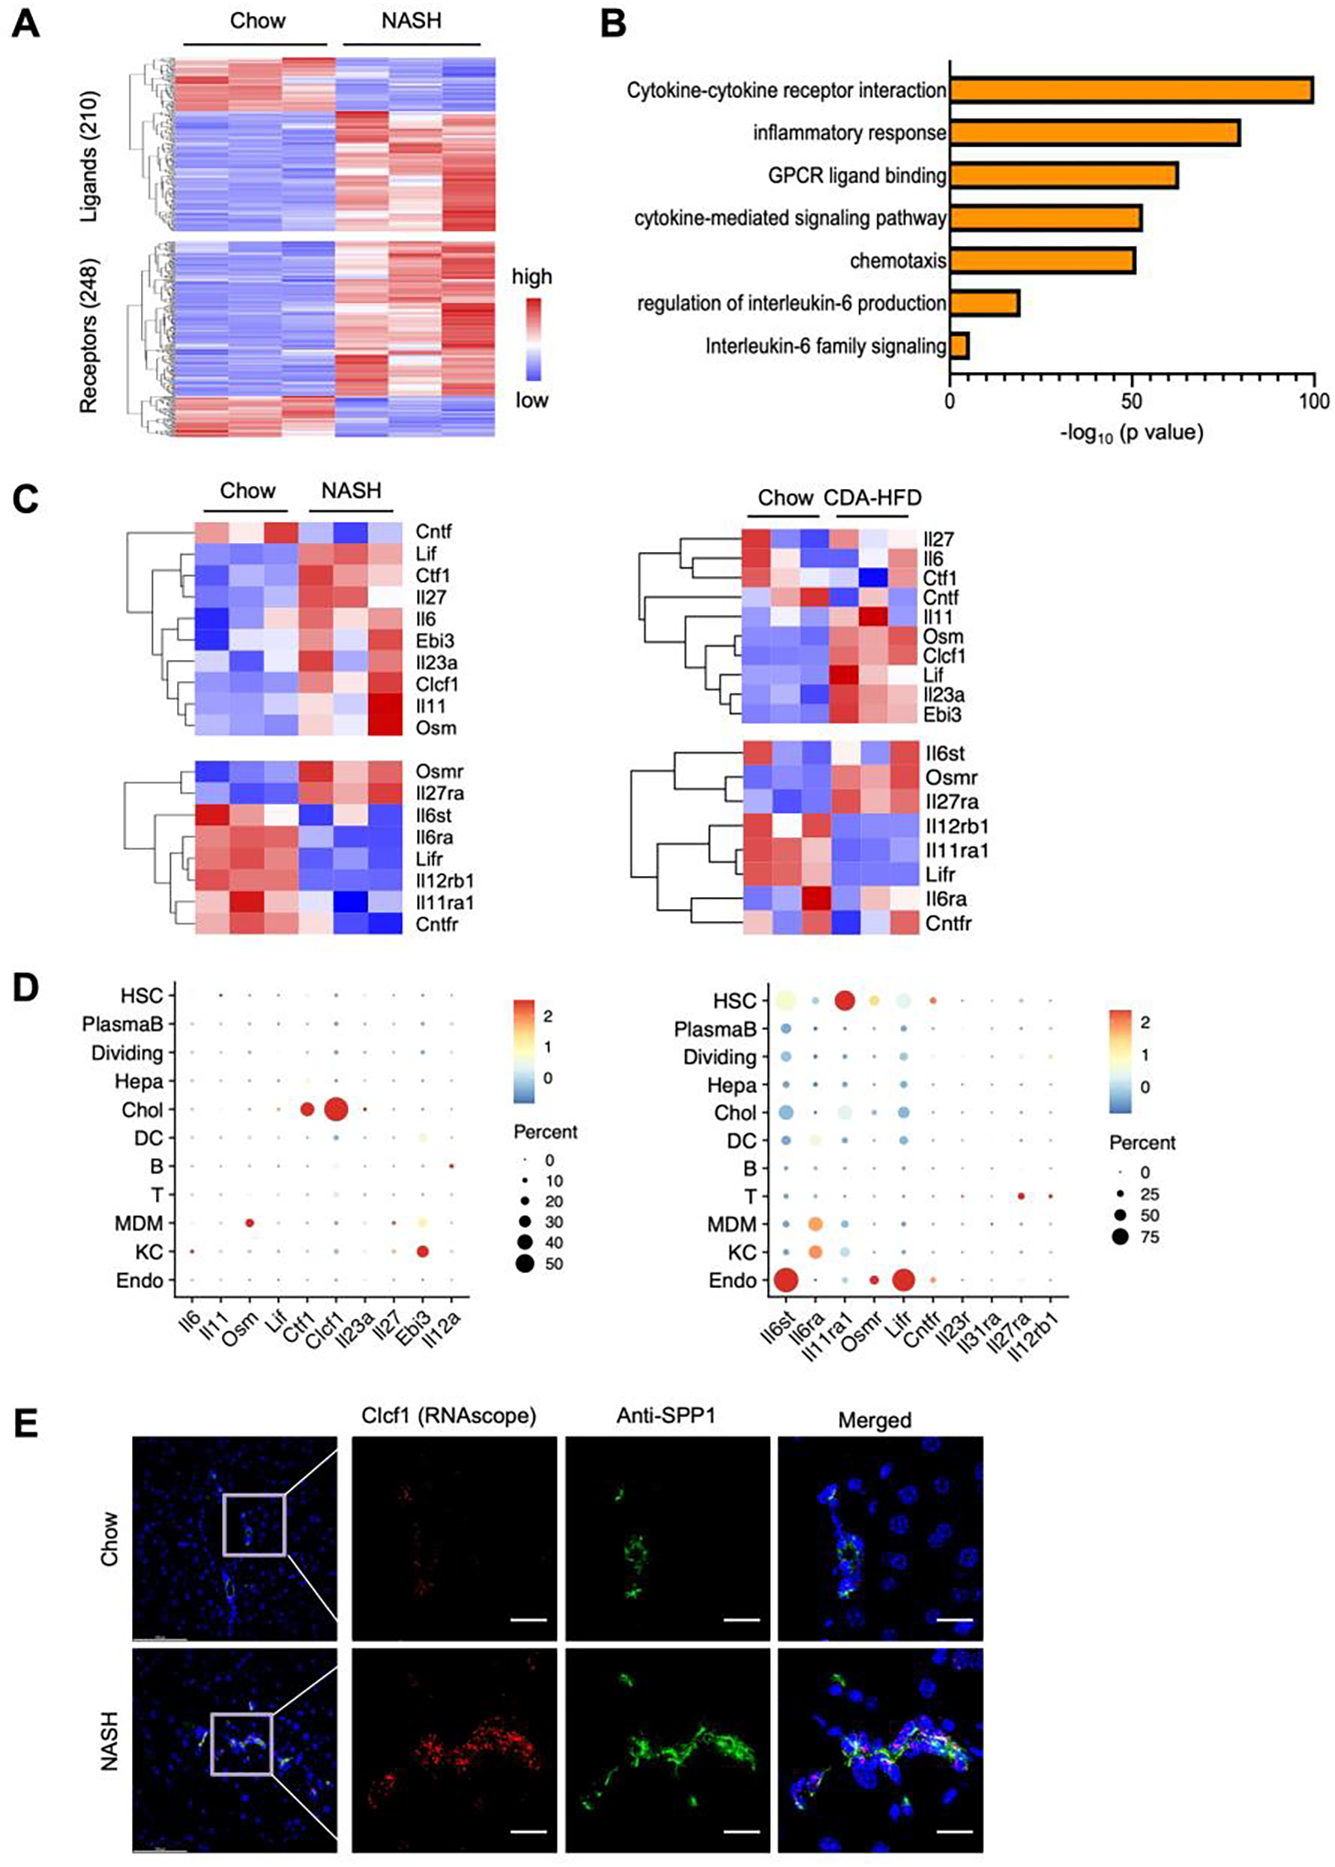
Figure 1. NASH is linked to altered IL-6 family cytokine signaling in the liver.

A) Heatmap of differentially expressed ligands (top) and receptors (bottom) based on bulk RNA sequencing analysis of the liver from mice fed chow or NASH diet for 20 weeks (GSE119340). Shown are genes that passed the filter of adjusted P-value < 0.05, absolute log2 (Fold change) > 0.5 and normalized count > 10 in at least one sample.
B) Pathway enrichment analysis of differential expressed ligands and receptors.
C) Heatmap of gene expression of IL-6 family members based on liver RNAseq data from mice fed chow or NASH diet for 20 weeks (left, GSE119340), and chow or CDA-HFD for 6 weeks (right, GSE128940).
D) Bubble plot of mRNA expression for IL-6 family ligands (left) and receptors (right) among different liver cell types based on single-cell RNAseq data (GSE129516).
E) RNAscope in situ hybridization (Clcf1) and immunofluorescence staining (anti-SPP1) of chow and NASH liver sections. Scale bar = 100μm.
