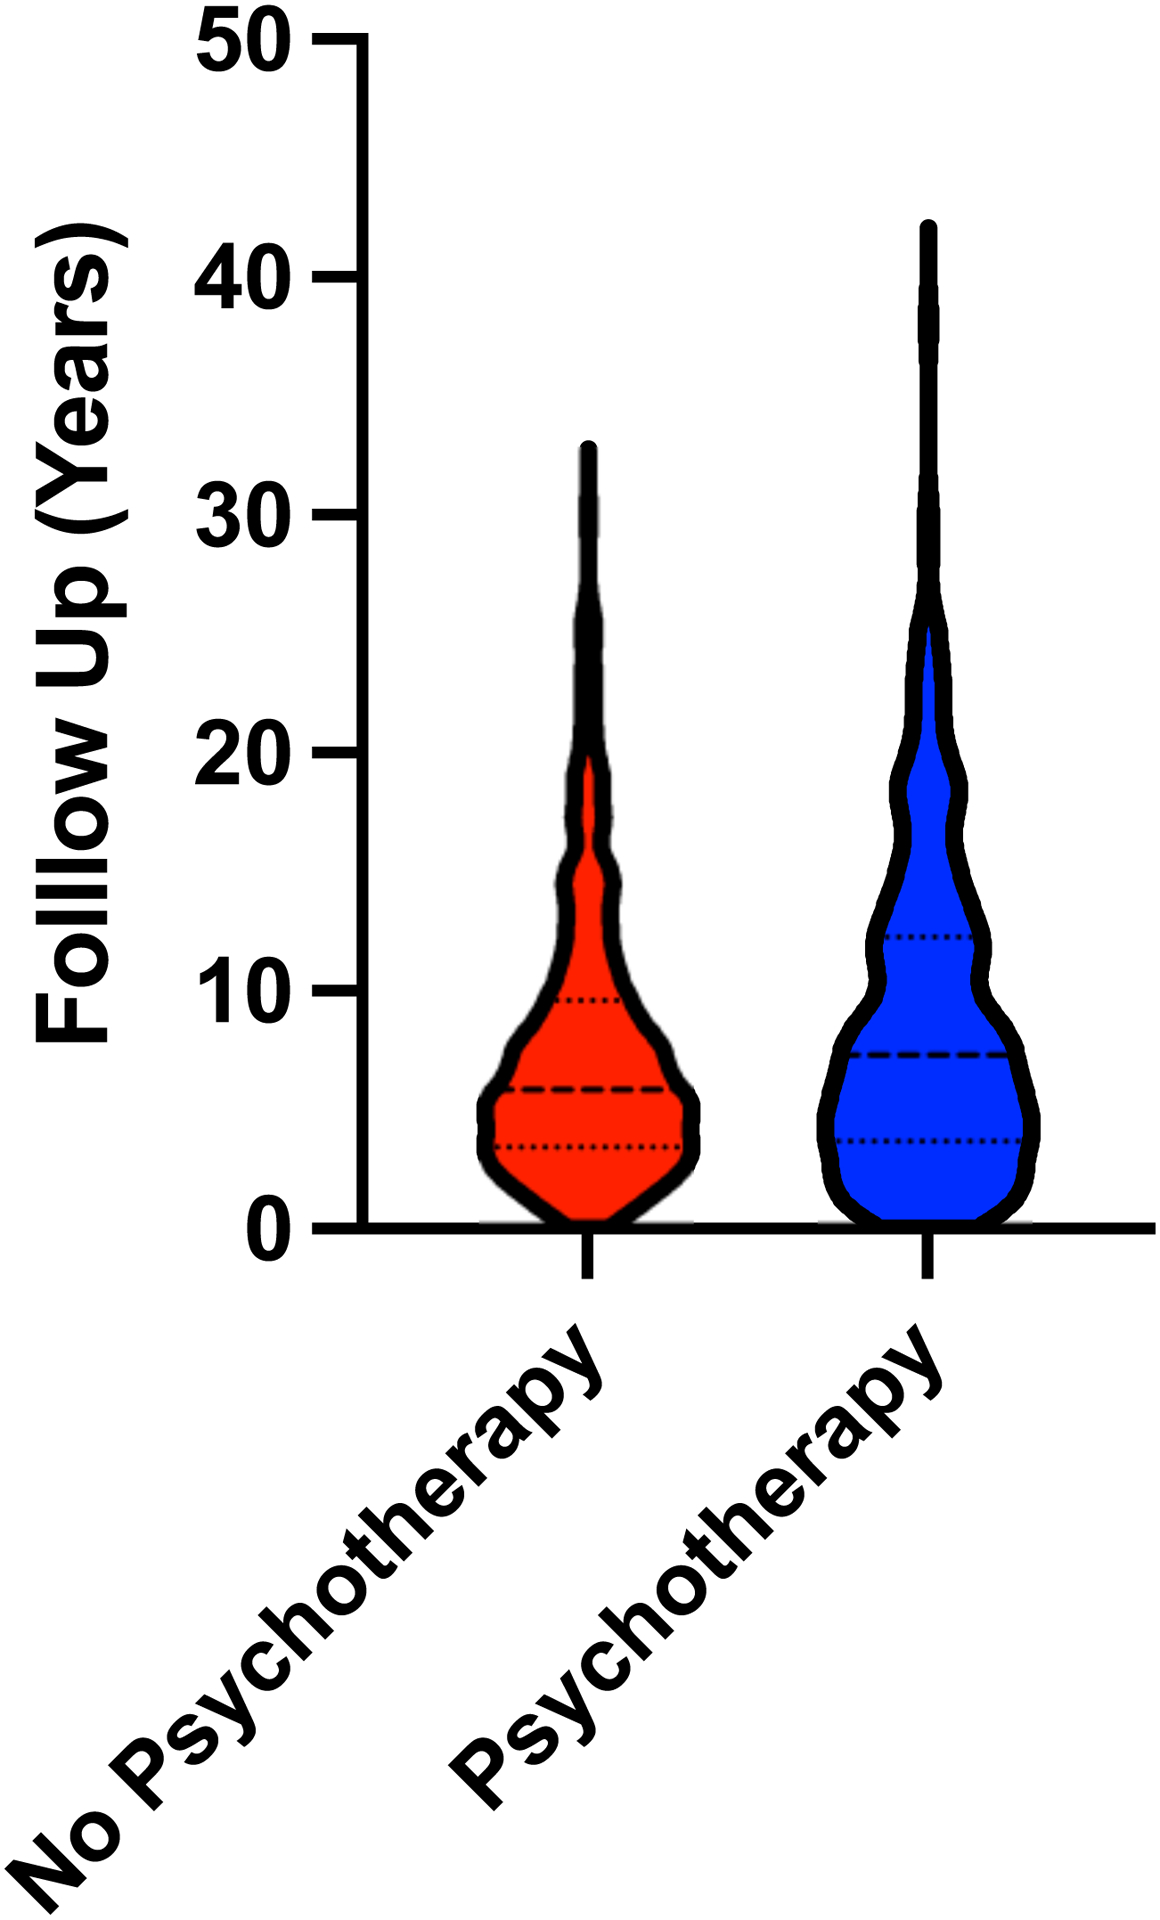
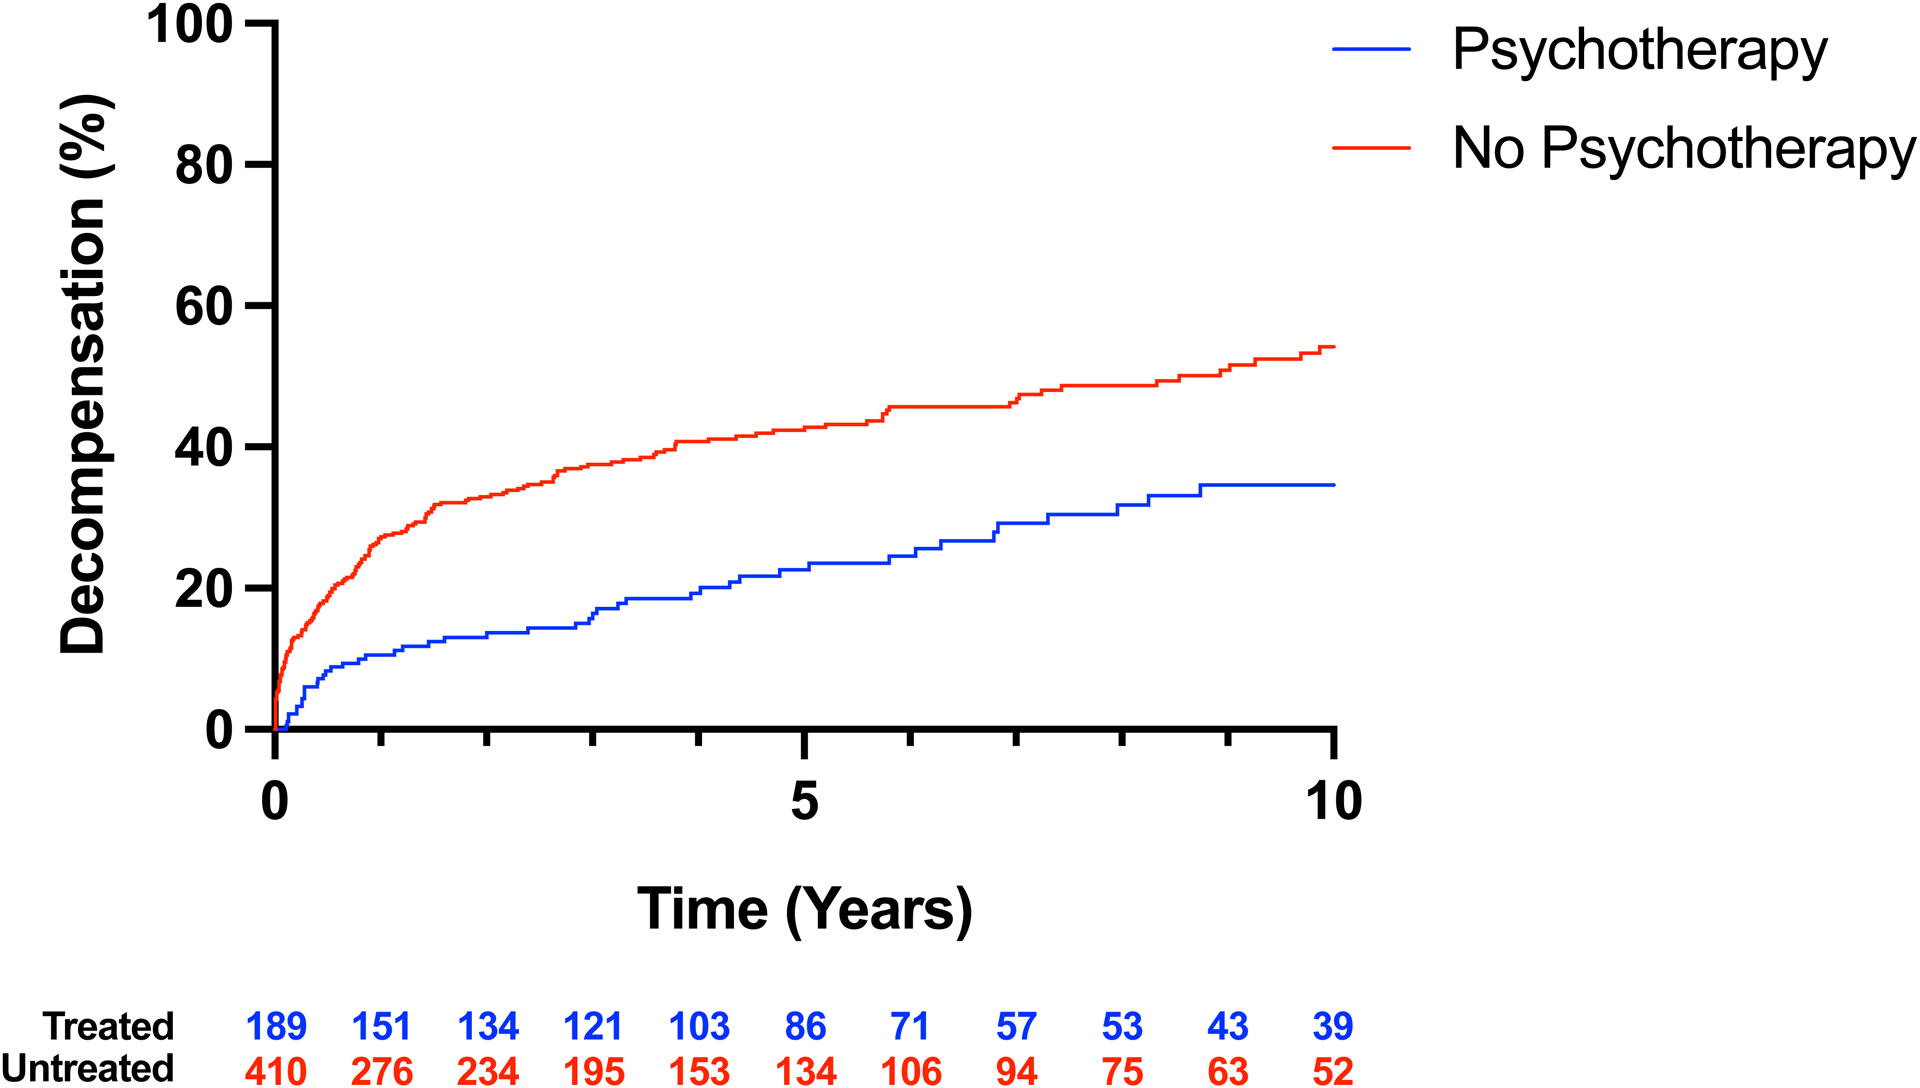
Figure 3. Development of hepatic decompensation in a subgroup of patients who develop cirrhosis according to psychotherapy.


A, Violin plot of follow-up after cirrhosis diagnosis in patients with and without psychotherapy treatment. Thickly dotted line represents the median, while the thinly dotted lines represent the 25th and 75th percentiles. B, Kaplan-Meier curve of decompensation in patients with cirrhosis treated and not treated with psychotherapy. The incidence of hepatic decompensation was lower in patients with cirrhosis that received psychotherapy than in patients that did not receive psychotherapy.
