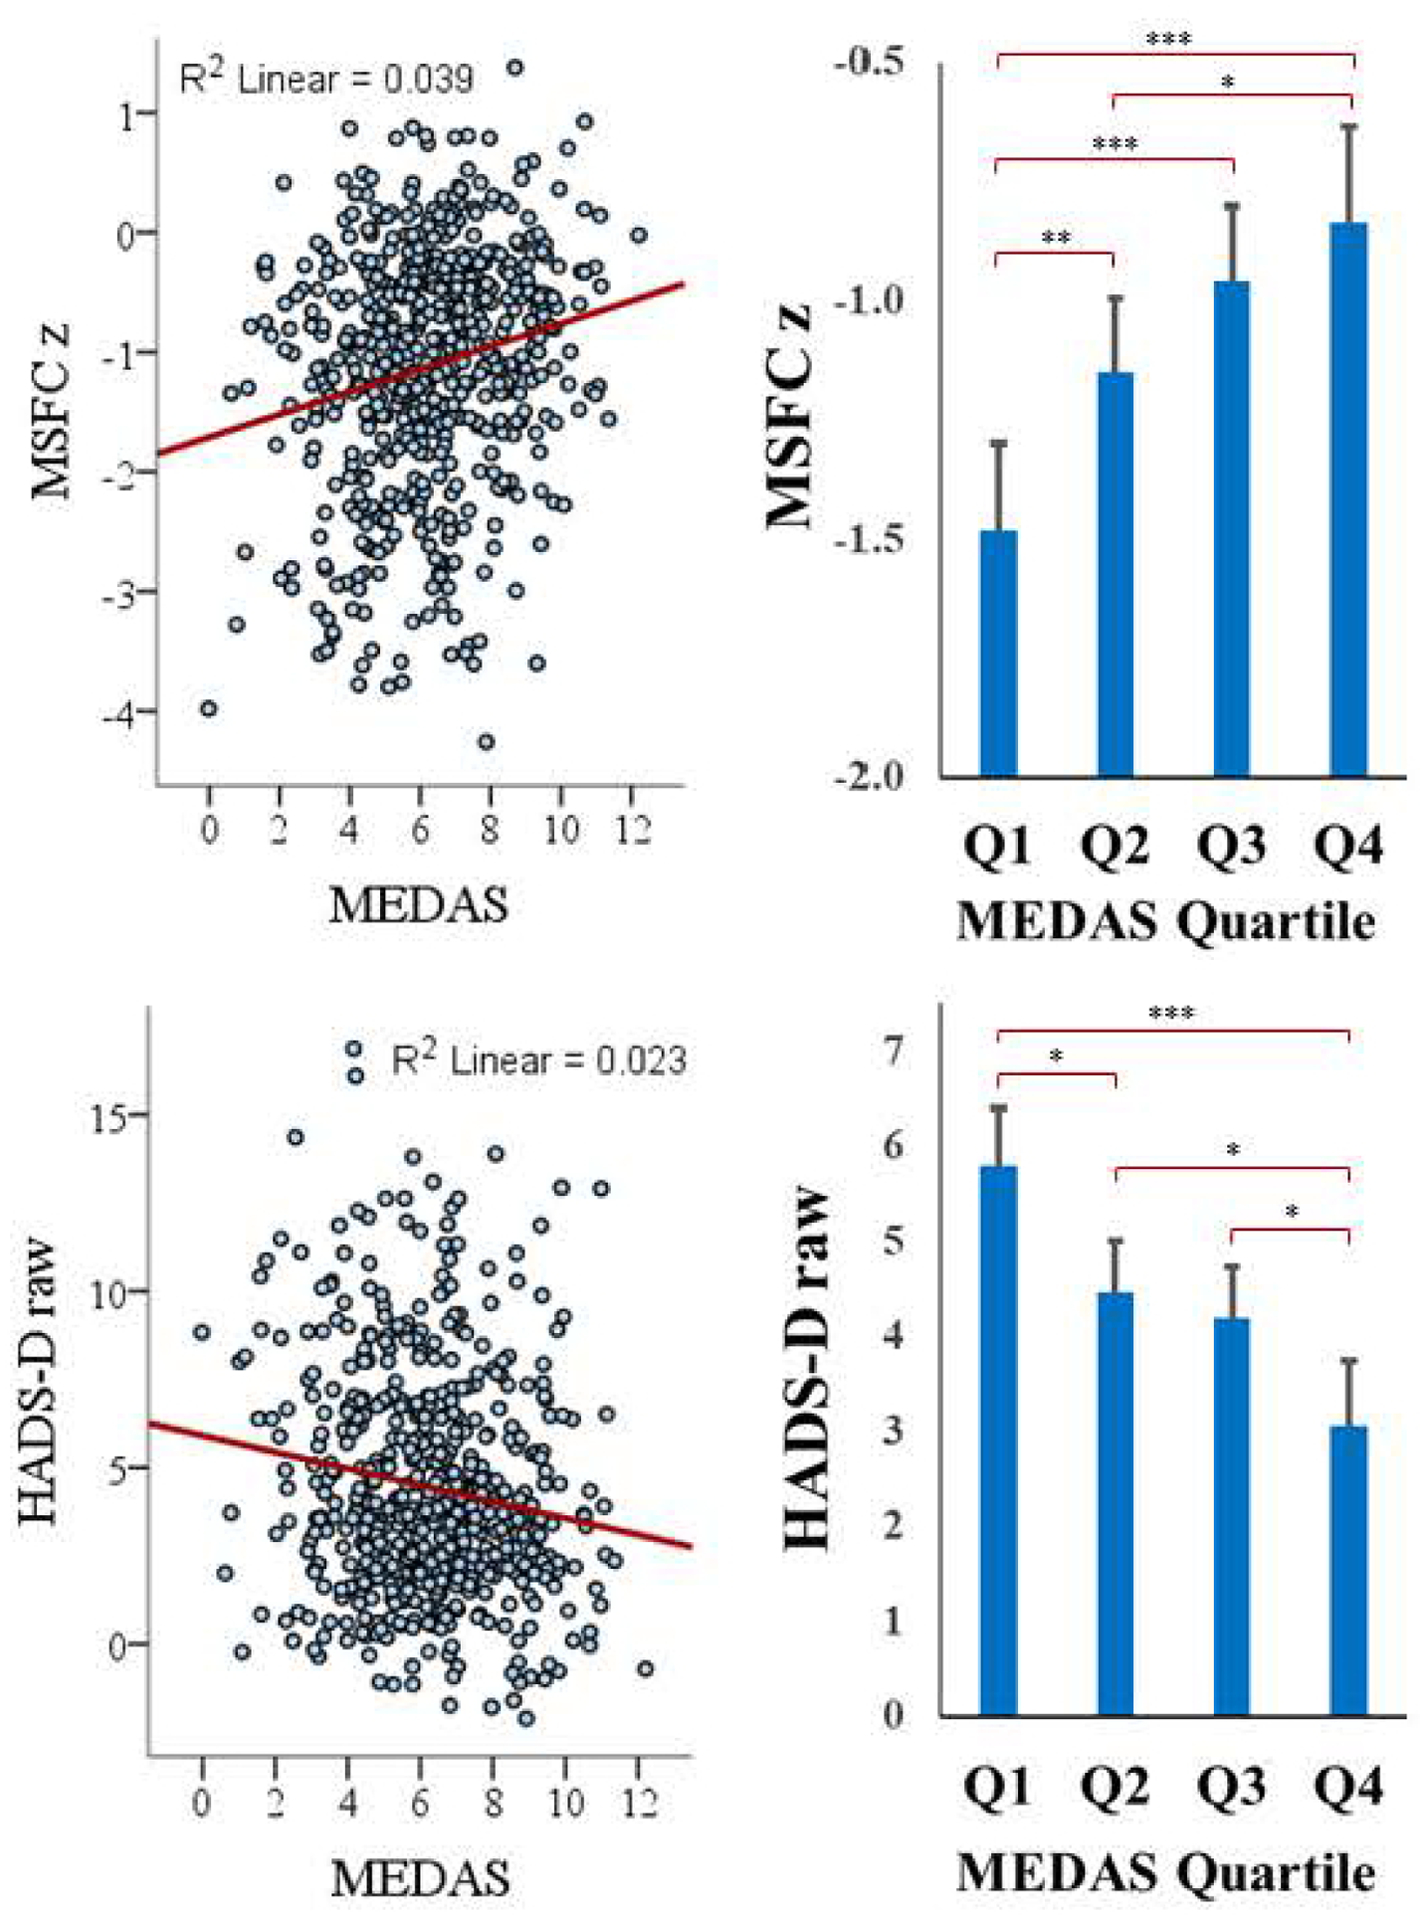
Figure 1: MEDAS and MS Metrics.

Relationships between MEDAS and 1) MSFC, 2) HADS-D. Panels on the left illustrate regression and on the right by MEDAS quartile. Higher MSFC indicates better performance. Levels of statistical significance between MEDAS quartiles are indicated as: *p<0.05, **p<0.01, ***p<0.001.
