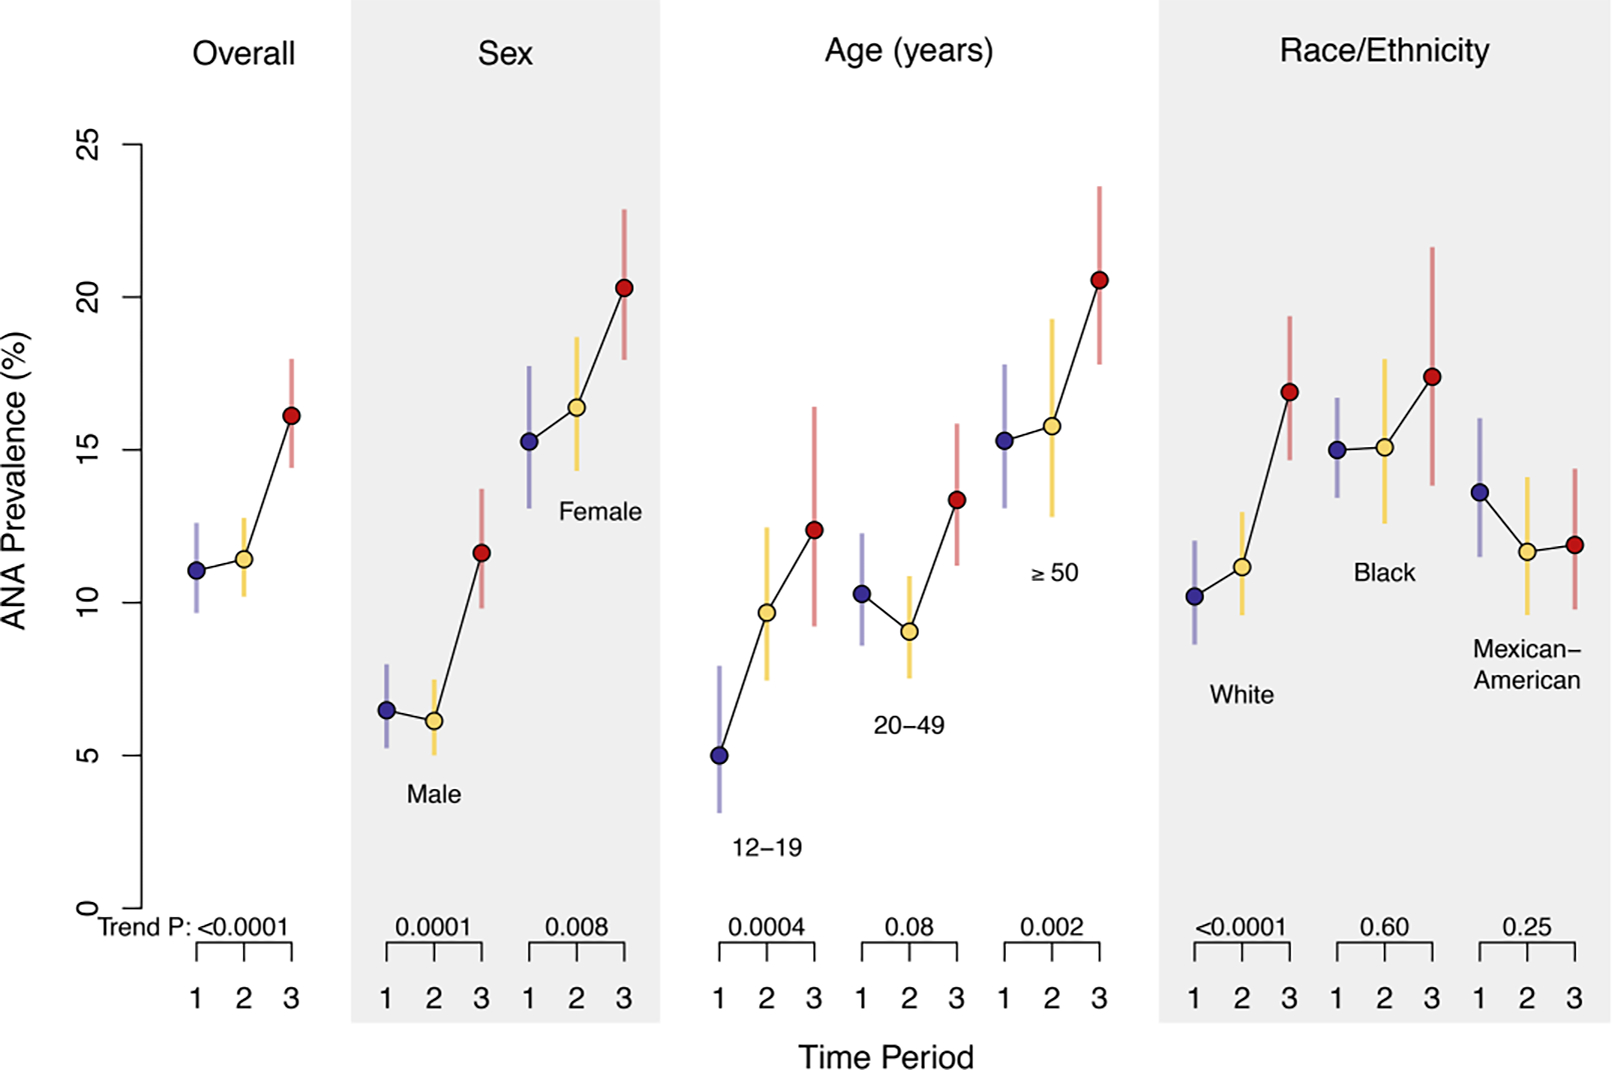
Figure 1.

The estimated prevalence of antinuclear antibodies (ANA) in demographic groups in the US population over time. Colored circles represent the weighted estimate of ANA prevalence, and the colored lines show the 95% confidence interval for period 1 (1988–1991, blue), period 2 (1999–2004, yellow), and period 3 (2011–2012, red). P values for ANA time trend are displayed below each category and were derived from a logistic regression model that was adjusted for sex, age, and race/ethnicity (reprinted with permission [12]).
