
Figure 2. Distribution of Key Start-up Activities by Site.
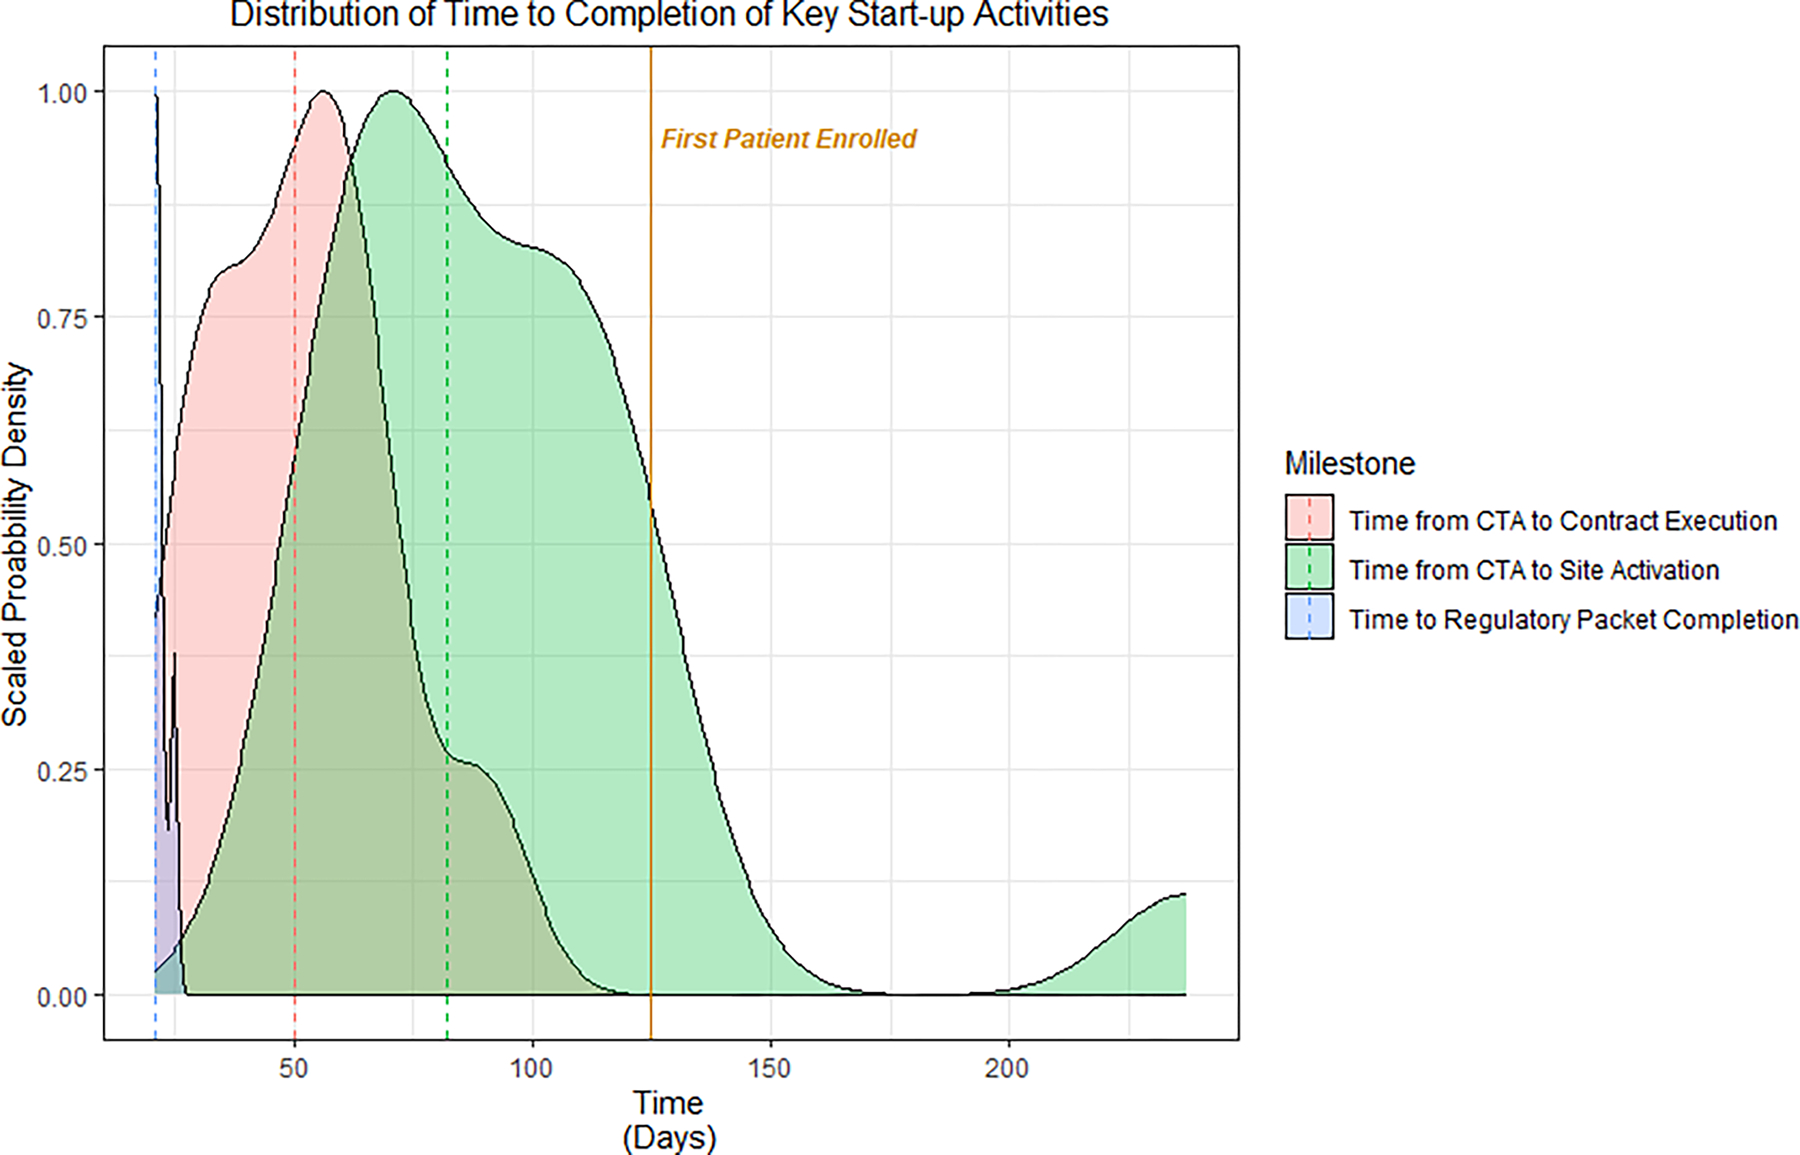
Probability density plot of time to start-up activities from n=19 sites. Time from regulatory packet completion (blue) was measured from the date that the regulatory packet was sent. The remainder of milestones shown were measured starting from the date that the clinical trial agreement (CTA) was sent. The dashed lines represent the median time for each milestone. Abbreviations: CTA: Clinical trial agreement.