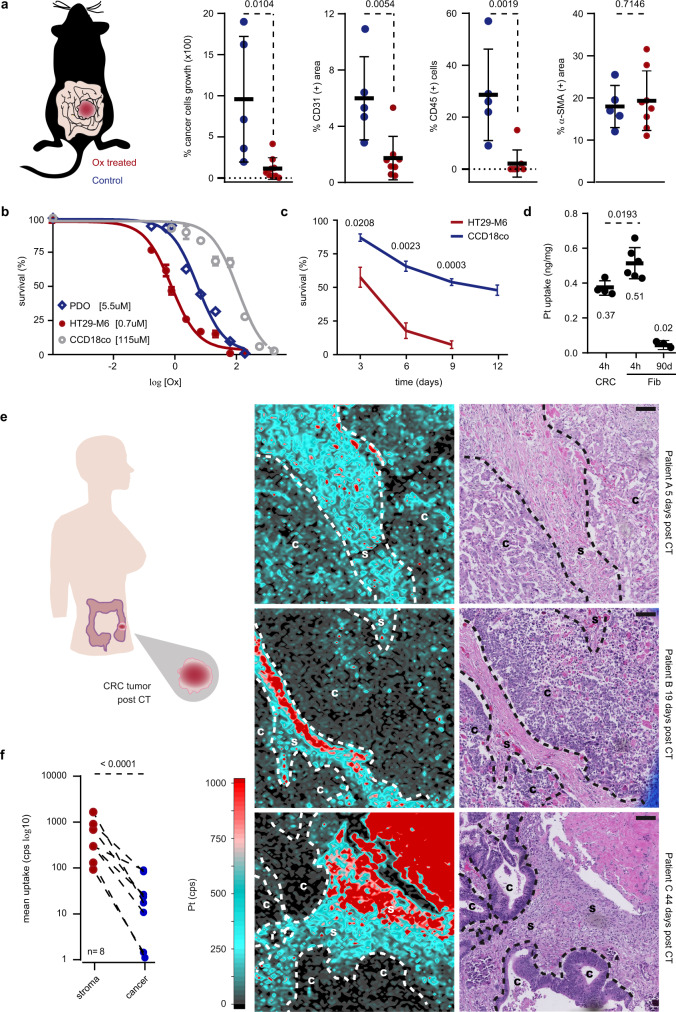
Fig. 1. Platinum accumulates within fibroblasts resilient to treatment.
a Tumor analysis in MTO-injected C57BL/6J mice treated with oxaliplatin. Left panel: percentage of tumor growth upon treatment. Right panels: percentage of CD31, CD45 and α-SMA intratumoral positivity. Control (blue; n = 5) and treated conditions (red; n = 8). Values are mean ± sd. p values are indicated. Drawing modified from Tauriello et al.17. b Biological activity of oxaliplatin against HT29-M6, PDO and CCD-18Co. Values are mean ± sd. EC50 are indicated. Representative of n = 3 biologically independent experiments. c 12-days follow-up of HT29-M6 and CCD-18Co cells survival upon oxaliplatin treatment. n = 3 biologically independent experiments. Values are mean ± sd. p value is indicated. d Oxaliplatin uptake in HT29-M6 (CRC) after 4 h treatment and in CCD-18Co (Fib) after 4 h treatment and 90 days after treatment. n = 6 biologically independent experiments. Mean quantities ± sd and p value are indicated. e Oxaliplatin biodistribution representative of eight independent patient tumors resected after CT. Time post CT is indicated. Left panels: platinum (Pt) uptake map. Right panels: corresponding hematoxylin and eosin staining, Scale bars: 100 μm. Drawing modified from Rivas, Linares et al.78. f Mean stromal (red) and cancer (blue) Pt uptake in samples from eight CRC patients. p value is indicated. PDO patient-derived tumor organoids, C cancer, S stroma, CT chemotherapy, cps count per second. Two-sided, unpaired (a, c, d) and paired (f) t-test p values (p) are indicated. Source data are provided as a Source Data file.

