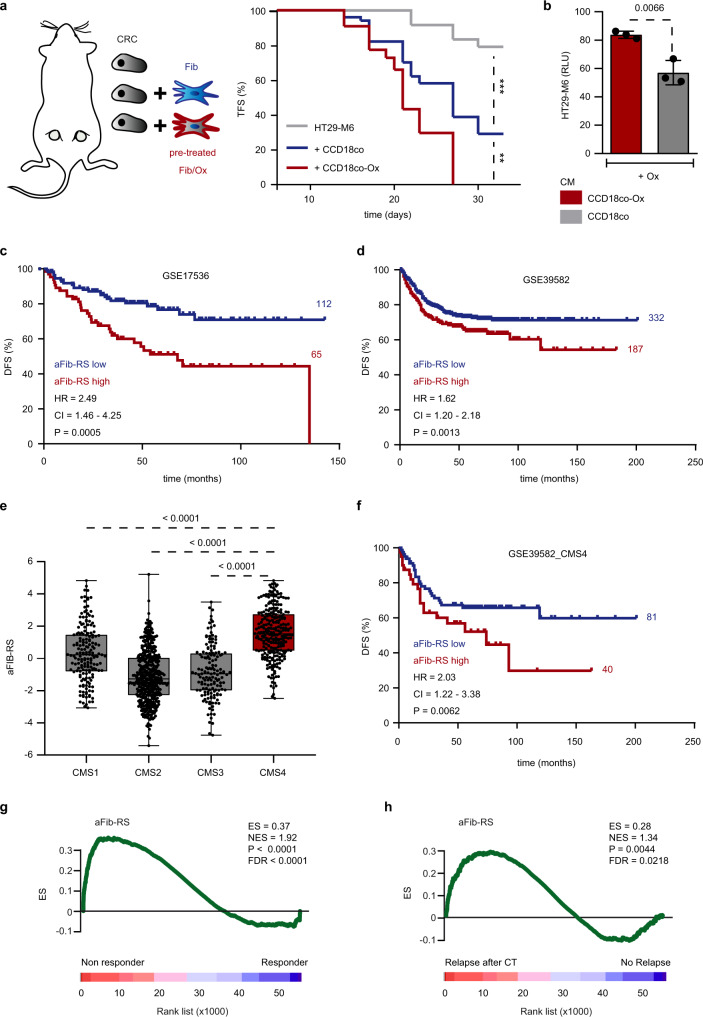
Fig. 2. Platinum-stimulated fibroblasts promote CRC progression.
a Kaplan–Meier plot displays tumor initiation overtime in nude mice injected subcutaneously with 15,000 HT29-M6 cells alone (gray; n = 24), co-injected with 50,000 CCD-18Co non-treated (blue; n = 50) or pre-treated with oxaliplatin (red; n = 44). **p = 0.0015, ***p = 0.0002. Drawing modified from Calon et al.33. b Quantitative analysis of oxaliplatin-treated HT29-M6 cells cultured with conditioned media (CM) from CCD-18Co non-treated or pre-treated with oxaliplatin. n = 3 biologically independent experiments. Values are mean ± sd. p value is indicated. c Kaplan–Meier curve displays DFS for GSE17536 patients (n = 177) presenting low (blue; n = 112) or high expression levels of aFib-RS (red; n = 65). HR, CI, p value are indicated. d Kaplan–Meier curve displays DFS for GSE39582 patients (n = 519) presenting low (blue; n = 332) or high expression levels of aFib-RS (red; n = 187). HR, CI, p value are indicated. e aFib-RS levels in n = 1029 CRC patients classified by CMS subtypes (CMS1 n = 175; CMS2 n = 445; CMS3 n = 147, CMS4 n = 262). Central mark indicates the median, box extends from the 25th to 75th percentiles, whiskers represent the maximum and minimum data point. p values are indicated. f Kaplan–Meier curve displays DFS for GSE39582_CMS4 patients (n = 121) presenting low (blue; n = 81) or high expression levels of aFib-RS (red; n = 40). HR, CI, p value are indicated. g GSEA of aFib-RS in the GSE72970 subset of tumor samples collected before treatment comparing patients responding to CT (n = 20) and unresponsive (n = 12) patients. h GSEA of aFib-RS in the GSE14333 subset of tumor samples collected before treatment comparing relapsing (n = 13) to non-relapsing (n = 38) patients after CT. ES enrichment score, NES normalized enrichment score, FDR false discovery rate. TFS tumor-free survival, CRC colorectal cell line (HT29-M6). Fib fibroblasts (CCD-18Co), DFS disease-free survival, HR hazard ratio, CI confidence interval, Ox oxaliplatin, GSEA gene set enrichment analysis, RLU relative luminescence unit. Two-sided, unpaired t-test p values (p) are indicated for b, e. Log-rank (Mantel–Cox test) p values (p) are indicated for a, c, d, f. GSEA nominal p value (p) and FDR-adjusted p value are indicated for g, h. Source data are provided as a Source Data file.

