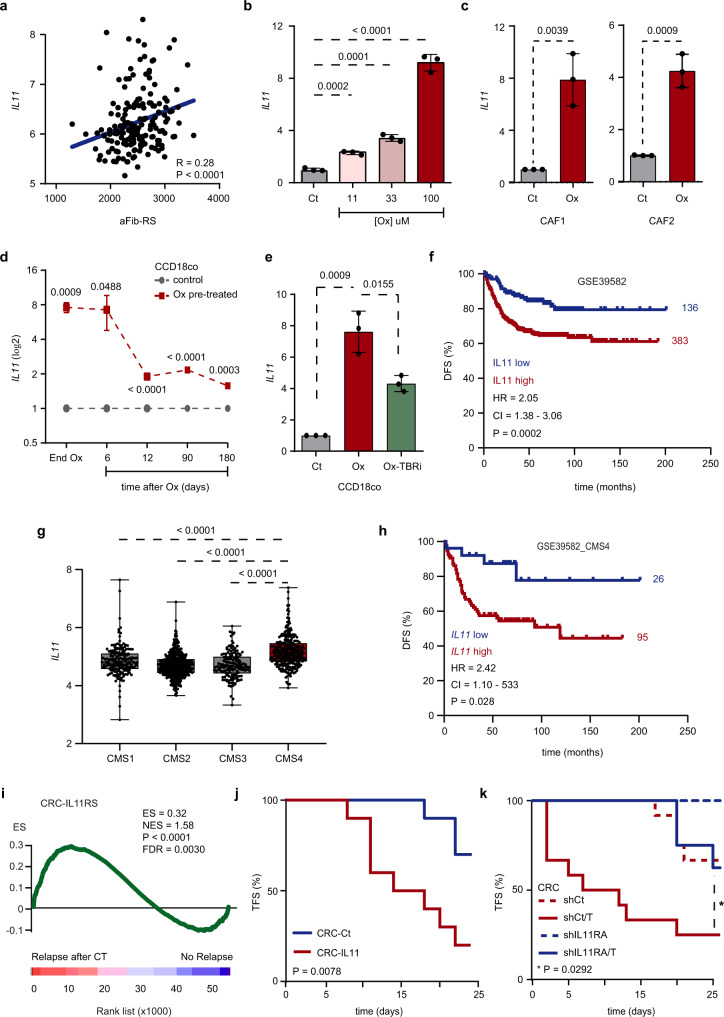
Fig. 4. TGF-beta pathway autocrine activation in platinum-stimulated fibroblasts upregulates IL11 secretion.
a Correlation between IL11 and aFib-RS in n = 177 CRC tumors from GSE17536. Correlation (R) and Spearman p value are indicated. b Relative expression levels of IL11 in CCD-18Co treated with increasing concentration of oxaliplatin. n = 3 biologically independent experiments. Values are mean ± sd. p values are indicated. c Relative expression levels of IL11 in CAF1 and CAF2 treated with oxaliplatin. n = 3 biologically independent experiments. Values are mean ± sd. p values are indicated. d Relative expression levels of IL11 in CCD-18Co 6, 12, 90 and 180 days after oxaliplatin retrieval. n = 3 biologically independent experiments. Values are mean ± sd. p values are indicated. e Relative expression levels of IL11 in CCD-18Co treated with oxaliplatin w/o TGF-beta pathway inhibitor (TBRi). n = 3 biologically independent experiments. Values are mean ± sd. p values are indicated. f Kaplan–Meier curve displays DFS for GSE39582 patients presenting low (blue; n = 136) or high (red; n = 383) expression levels of IL11. HR, CI and p value are indicated. g IL11 levels in n = 1029 CRC patients classified by CMS subtypes (CMS1 n = 175; CMS2 n = 445; CMS3 n = 147, CMS4 n = 262). Central mark indicates the median, box extends from the 25th to 75th percentiles, whiskers represent the maximum and minimum data point. p values are indicated. h Kaplan–Meier curve displays DFS for GSE39582_CMS4 patients presenting low (blue; n = 26) or high (red; n = 95) expression levels of IL11. HR, CI and p value are indicated. i GSEA of CRC-IL11RS comparing relapsing (n = 13) to non-relapsing (n = 38) patients after CT in GSE14333. j Kaplan–Meier plot displays tumor initiation overtime in nude mice injected subcutaneously with 30,000 HT29-M6 control (blue; n = 10) or IL11-secreting cells (red; n = 10). p value is indicated. k Kaplan–Meier plot displays tumor initiation overtime in nude mice injected subcutaneously with 30,000 HT29-M6 control cells (dashed red; n = 12), TGF-beta secreting cells (red; n = 12), shIL11RA cells (dashed blue; n = 8) or with shIL11RA/TGF-beta-secreting cells (blue; n = 8). p value is indicated. CRC: HT29-M6; TFS tumor-free survival, DFS disease-free survival, HR hazard ratio, CI confidence interval, Ox oxaliplatin, Ct control, CT chemotherapy. Two-sided, unpaired t-test p values (p) are indicated for b–e, g. Log-rank (Mantel–Cox test) p values (p) are indicated for f, h, j, k. GSEA nominal p value (p) and FDR-adjusted p value are indicated for i. Source data are provided as a Source Data file.

