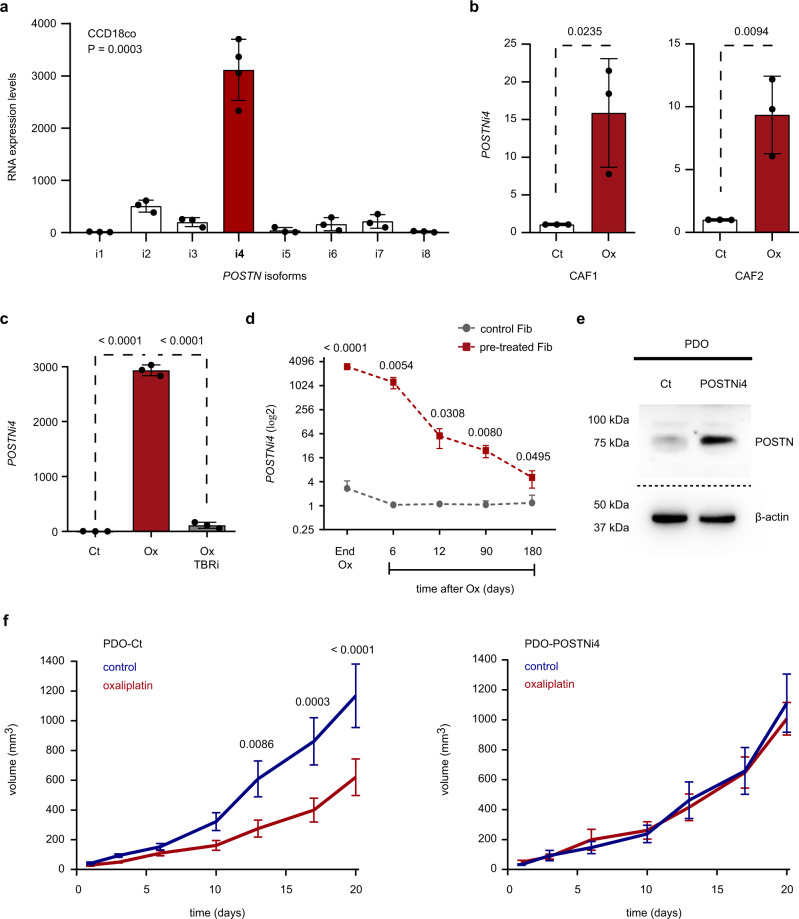
Fig. 7. Platinum-induced expression of POSTN isoform 4 in the tumor stroma enhances resistance to treatment.
a Relative expression levels of POSTN isoforms in CCD-18Co treated with oxaliplatin. n = 4 and n = 3 biologically independent experiments for POSTNi4 and for POSTNi1-3, 5-8 respectively. Values are mean ± sd. p value is indicated. b Relative expression levels of POSTNi4 in CAFs treated with oxaliplatin. n = 3 biologically independent experiments. Values are mean ± sd. p values are indicated. c Relative expression levels of POSTNi4 in CCD-18Co treated with oxaliplatin w/o TGF-beta pathway inhibitor (TBRi). n = 3 biologically independent experiments. Values are mean ± sd. p values are indicated. d Relative expression levels of POSTNi4 in CCD-18Co 6, 12, 90, 180 days after oxaliplatin retrieval. n = 3 biologically independent experiments. Values are mean ± sd. p value is indicated. e POSTN protein levels in genetically engineered PDOs with upregulated expression of POSTNi4 compared to control cells. Bottom panel shows β-Actin protein levels as normalization control. Representative of n = 3 biologically independent experiments. f Growth kinetics upon oxaliplatin treatment of tumors derived from subcutaneous injection into NSG mice of PDOs-Ct or POSTNi4-secreting PDOs. Left panel: PDOs-Ct injected mice tumors treated (red; n = 10) or non-treated tumors (blue; n = 9). Right panel: POSTNi4-PDOs injected mice tumors treated with oxaliplatin (red; n = 9) or non-treated tumors (blue; n = 7). Values are mean ± sem. p values are indicated. PDO patient-derived tumor organoids, Fib CCD-18Co, Ct control, Ox oxaliplatin. Two-sided, unpaired t-test p values (p) are indicated for a–d, f. Source data are provided as a Source Data file.

