Figure 4.
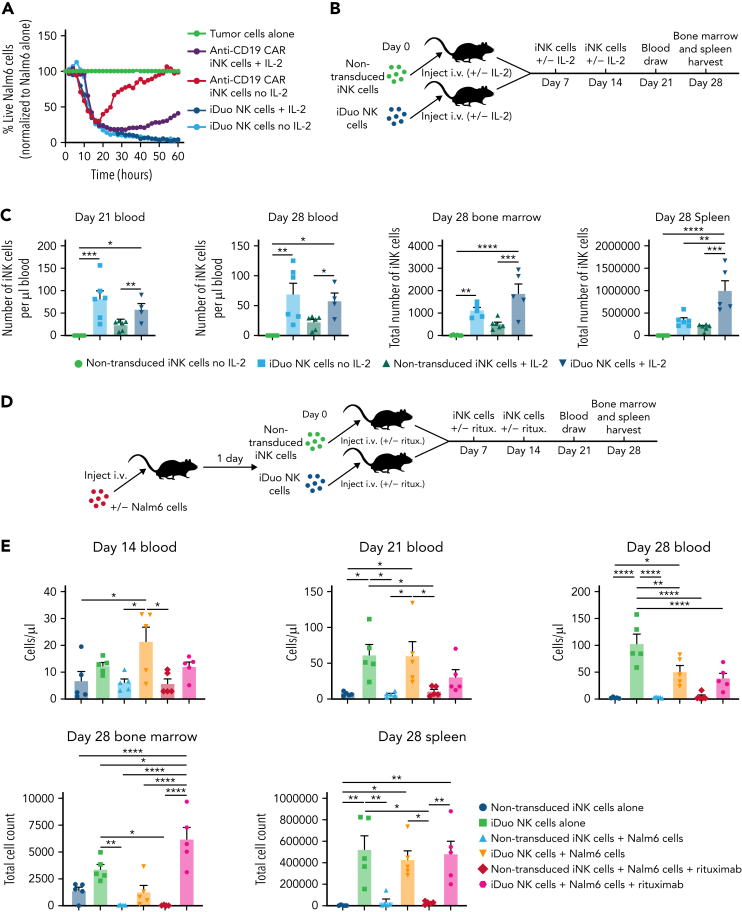
iDuo NK cells are cytokine-autonomous. (A) Anti-CD19 CAR iNK cells and iDuo NK cells were cocultured with NLR-transduced Nalm6 cells in the presence or absence of 50 U/mL IL-2. Target cell killing was assessed in IncuCyte assays, and the percentages of live Nalm6 cells in each condition were normalized to Nalm6 cells cultured alone. All conditions were run in triplicate. Results are representative of two experiments. (B) Schematic for the experiments designed to assess the persistence of non-transduced iNK cells and iDuo NK cells in vivo with and without cytokine support. (C) 1 × 10⁷ non-transduced iNK cells or iDuo NK cells were injected IV into NSG mice (n = 6 mice per group) once per week for 3 weeks with or without 5 × 10⁴ U IL-2. One mouse in the iDuo NK cell group with IL-2 died prematurely of causes unrelated to the NK cell transfer. Blood draws were taken at days 21 and 28, and iNK cell counts were determined by flow cytometry using antibodies specific for human CD45 and CD56. Mice were killed at day 28, and bone marrow and spleen were collected for assessment of iNK cell counts. Results are from two independent experiments. Statistical significance was determined using one-way ANOVA. (D) Schematic for experiments designed to assess iNK cell numbers in tissues of mice injected with tumor and rituximab. (E) 1 × 10⁵ Nalm6-luc cells were injected IV into groups of NSG mice (n = 5 per group). The next day, 1 × 10⁷ non-transduced iNK cells or iDuo NK cells were injected IV with or without IP injections of rituximab (2 μg/mouse). Non-tumor–bearing mice also received IV injections of non-transduced iNK cells or iDuo NK cells (n = 5 per group). Mice received subsequent iNK cell and rituximab injections at days 7 and 14. Blood draws were performed at days 14, 21, and 21 for assessment of iNK cell numbers in peripheral blood. Mice were sacrificed at day 28, and bone marrow and spleen tissues were collected for analysis of iNK cell counts. Results are from two independent experiments. Statistical significance was determined using one-way ANOVA. Shown is mean ± standard deviation. ∗P ≤ .05, ∗∗P ≤ .01, ∗∗∗P ≤ .001, ∗∗∗∗P ≤ .0001.

